
XRP has managed to protect a key support level at $0.50 after the recent market crash earlier this week. The coin has seen a price rebound of almost 4% over the past 24 hours, making XRP one of the top performing cryptocurrencies among the top 100 by market capitalization.
The price of XRP fell to the trend line and then declined to the resistance zone around $0.68. After bouncing back up briefly, the price continued to fall, breaking through the $0.68 support level. XRP tried to recover but faced rejection again. This initiated a further drop, with XRP breaking below the trend line and falling to the next support at $0.48.
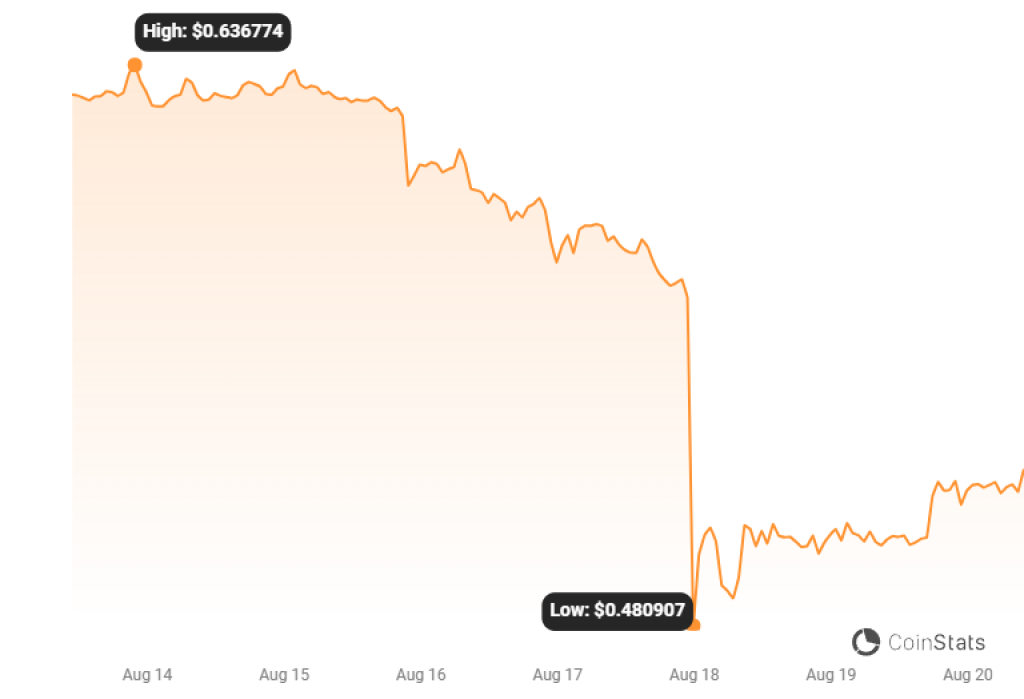
Source: CoinStats
After trading sideways near $0.5 for a period, XRP bounced back up. However, XRP may rise to retest the trend line before starting to fall back towards the support zone. There is a possibility that XRP could break below the $0.48 support level and continue declining towards the next target at $0.45.
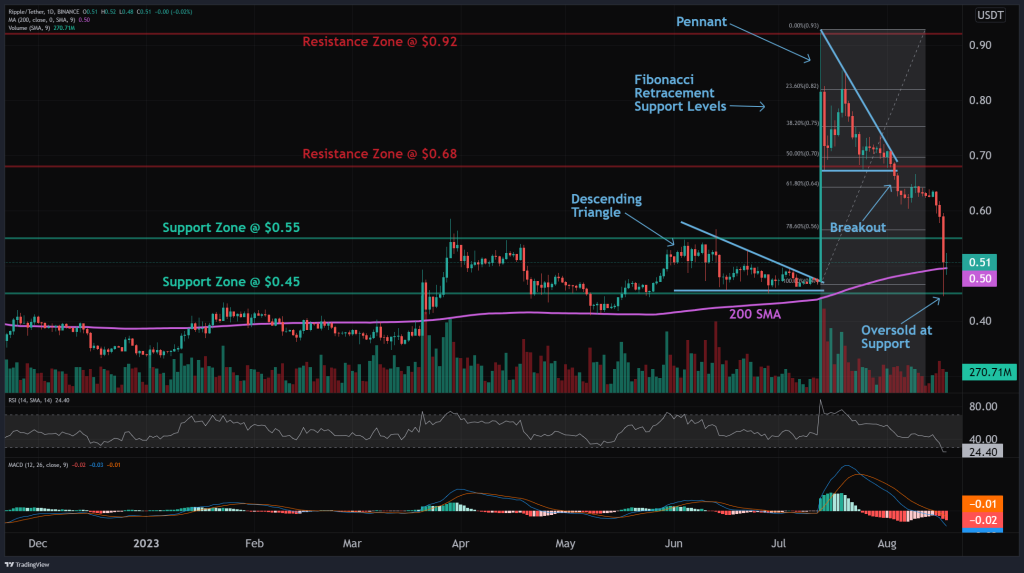
Key Fibonacci retracement support levels are at $0.70 (50%) and $0.56 (78%). With XRP currently oversold near $0.50 support, this area could offer an attractive swing trade entry point for traders betting on an uptrend.
XRP – Technical Indicators Suggest Bearish Signs
The momentum indicators also suggest a bearish outlook currently. The MACD line is below the MACD signal line and the RSI is below 45. This points to downward momentum.
The Relative Strength Index (RSI) is a technical indicator that measures the momentum and velocity of recent price changes to determine if an asset is overbought or oversold. The RSI ranges from 0 to 100.
A reading below 45 on the RSI suggests that the asset (in this case XRP) is in oversold territory. This means selling momentum has exceeded buying momentum, driving the price down. When the RSI is this low, it usually indicates the price may be due for a bounce or recovery soon as it is considered overextended to the downside.
However, the RSI below 45 is not an outright buy signal. It suggests downward momentum is strong and additional oversold conditions could still materialize. Traders will often look for the RSI to form a positive divergence or move back above 45-50 to show early signs of shifting momentum from bearish to bullish. But a low RSI suggests traders should be cautious of further downside even as it reaches levels that may precede a bounce.
Source: altFINS
The Moving Average Convergence Divergence (MACD) is a trend-following momentum indicator that shows the relationship between two moving averages of an asset’s price.
The MACD line (also called the MACD 12-day EMA – exponential moving average) reflects short-term momentum, while the MACD signal line (also called the 26-day EMA) represents an average of the MACD line.
When the MACD line crosses below the MACD signal line, it indicates that the short-term momentum is weakening and the asset is losing upside momentum. This is known as a bearish crossover and often signals that price may continue declining.
So in the case of XRP, the MACD line crossing below the MACD signal line is a bearish sign. It suggests downside momentum is accelerating as the faster MACD line drops below the slower signal line. This implies that the short-term trend is turning increasingly negative.
The nearest support zone for XRP is at $0.50, which it already broke below. The next support is at $0.45. On the resistance side, the nearest zone is at $0.68, followed by $0.92.
Traders will be watching to see if XRP can continue its bounce from the $0.50 support or if bearish momentum will push it lower. The direction of Bitcoin and overall crypto market sentiment will also play a key role in XRP’s price action.

We recommend eToro
Wide range of assets: cryptocurrencies alongside other investment products such as stocks and ETFs.
Copy trading: allows users to copy the trades of leading traders, for free.
User-friendly: eToro’s web-based platform and mobile app are user-friendly and easy to navigate.