Worldcoin price has started to push higher after months of decline, and the latest WLD chart now shows a structure that could change the current trend. The daily timeframe reveals a falling wedge pattern that has already broken to the upside, which often appears when selling pressure begins to weaken.
Price recently moved above the upper boundary of the wedge near $0.31, which is the first sign that buyers are stepping back into the market. The setup shared in the chart shows a clear breakout zone with a projected move toward $0.60. That move represents close to a 100% upside if the structure plays out fully.
The move higher did not come out of nowhere. A long period of lower highs and lower lows compressed price into a narrowing range. That compression often leads to expansion, and this breakout could be the early stage of that expansion.
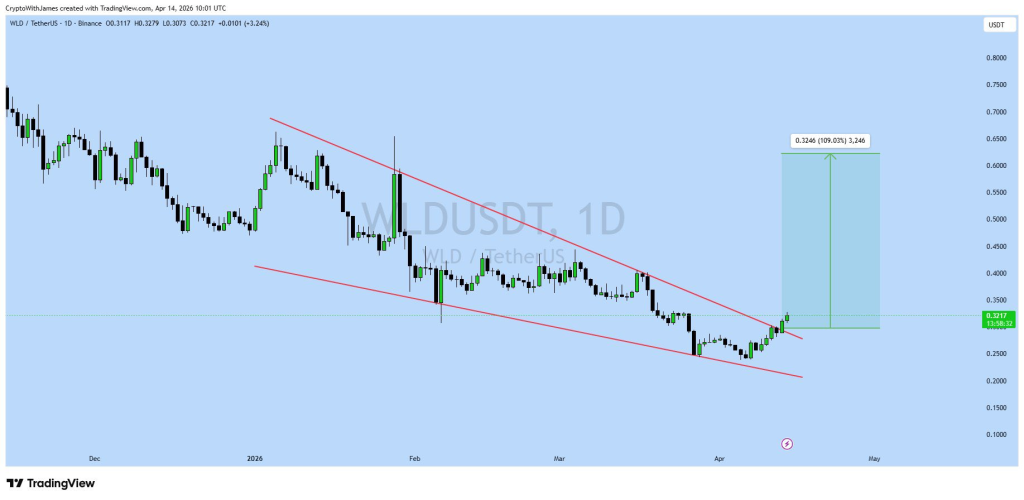
ATradeSniper explains that WLD has already completed the breakout on the daily timeframe, which increases the chances of continuation if buyers maintain control. The projection toward $0.60 comes from measuring the height of the falling wedge and extending that range upward from the breakout point.
That projection gives a technical target, but it does not remove risk. ATradeSniper points out that this type of move usually needs confirmation. Price often revisits the breakout level before continuing higher, and that behavior can shake out early buyers.
The current WLD price sits close to a resistance area near $0.35. A strong push above that level would support the bullish case. Failure to hold above $0.31 could weaken the setup and pull price back into the previous structure.
Technical Indicators Show Mixed And Mostly Bearish Signals Despite WLD Breakout
| Technical Indicators | Value | Action |
|---|---|---|
| RSI (14) | 51.871 | Neutral |
| STOCH (9,6) | 36.726 | Sell |
| MACD (12,26) | 0.07 | Buy |
| ADX (14) | 27.438 | Sell |
| Ultimate Oscillator | 40.497 | Sell |
| ROC | -2.358 | Sell |
The indicator readings show a mixed picture, and most of them lean bearish despite the breakout structure. RSI near 52 places WLD price in a neutral zone, which means there is no strong momentum behind the current move.
MACD shows a buy signal, which supports the idea that momentum could shift upward. Other indicators tell a different story. Stochastic remains weak, which shows that buyers have not fully taken control. ADX suggests that the trend strength is still limited, so the breakout lacks strong confirmation.
ROC remains negative, which means recent price action still carries downside pressure. The Ultimate Oscillator also sits below mid-level, which adds to the cautious outlook.
Read Also: What $100 Oil Means for Bitcoin and Crypto Markets in 2026
The current Worldcoin setup presents a clear contradiction. The falling wedge breakout points toward a possible upside move, and ATradeSniper maintains a target close to $0.60. The indicator readings do not fully support aggressive buying at this stage.
This combination often creates risky conditions for early entries. Buyers who enter too quickly could face a pullback if price retests the breakout level near $0.31. A stronger setup would appear if WLD price breaks above $0.35 and holds that level with steady buying pressure.
FAQs
Subscribe to our YouTube channel for daily crypto updates, market insights, and expert analysis.