Top crypto analysts Captain Faibik and Rekt Capital have lately shared bullish outlooks on Pyth Network (PYTH) and Avalanche (AVAX) based on their technical analysis. Besides, according to CoinMarketCap data at the time of this publication, Pyth Network is currently trading at $0.966185, up 2.65% in the last 24 hours. Meanwhile, Avalanche’s price stands at $54.13, with a modest 0.23% gain over the same period.
What you'll learn 👉
PYTH: Bullish Pennant Breakout Signals Potential Rally
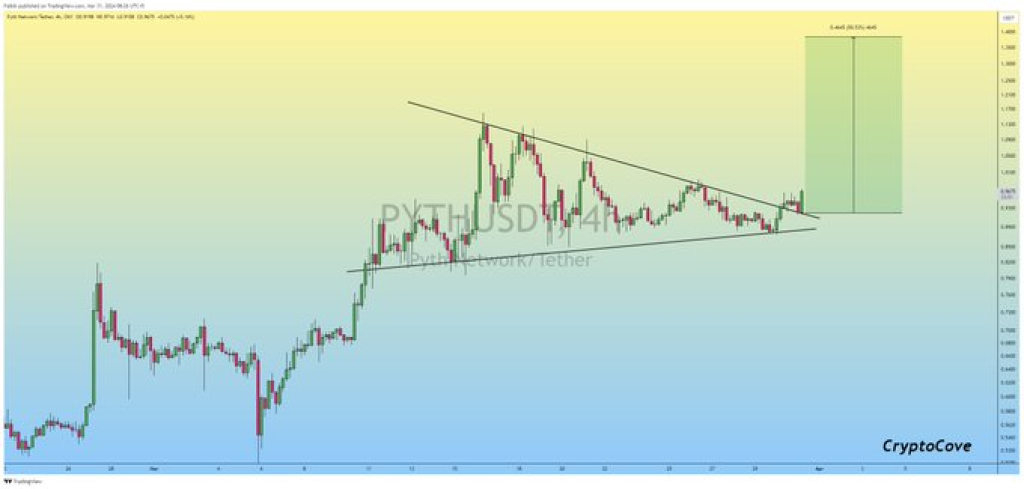
According to Captain Faibik, a top crypto analyst, Pyth Network (PYTH) has confirmed a bullish pennant upside breakout/retest pattern lately. Consequently, Faibik expects another 50% bullish rally for the crypto, urging investors not to miss the ride.
Captain Faibik’s daily chart analysis reveals a descending triangle pattern, characterized by converging trendlines sloping downwards towards the right. However, the chart highlights a breakout area to the right, where the price is seen breaking out from the triangle pattern, typically interpreted as a bullish signal.

Moreover, the chart identifies a target area labeled “1.618 Fib Extension,” referring to the Fibonacci extension level, a tool used by traders to predict potential levels of support or resistance. The 1.618 level is often associated with a significant price move and is used to set a price target.
Doge2014 raises 500K in days celebrating Dogecoin. Make potentially big profits and get in on exclusive airdrop!
Show more +AVAX: Healthy Dip Paves the Way for Uptrend
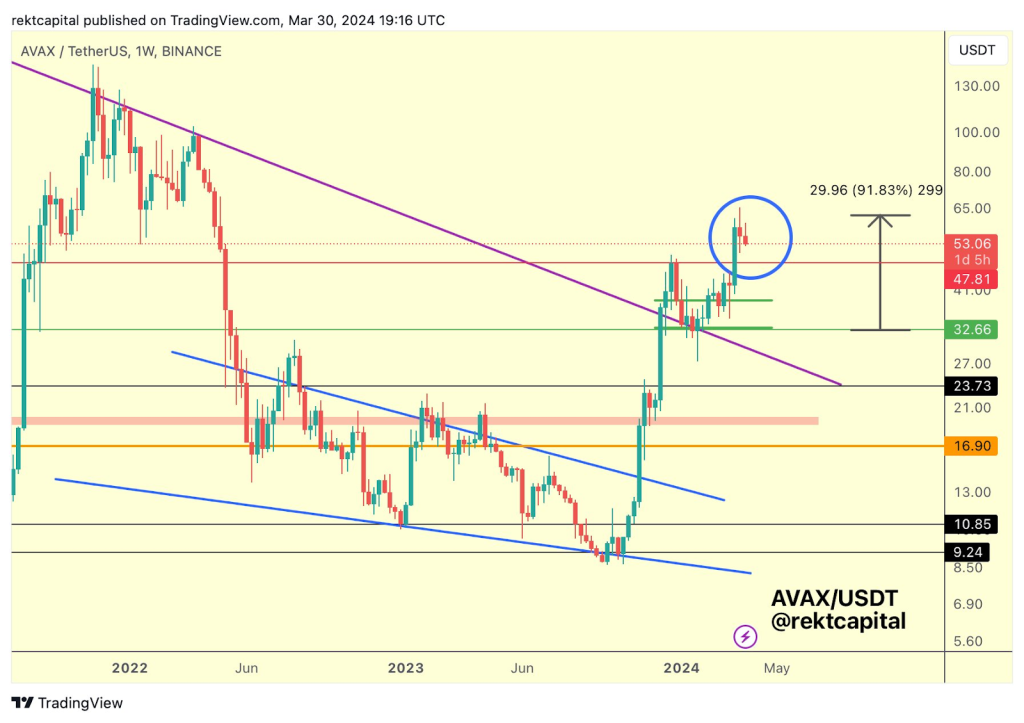
Rekt Capital, another respected cryptocurrency analyst, has shared insights on Avalanche (AVAX). According to Rekt Capital’s analysis, AVAX rallied to the $65-$70 area and is now dipping towards the December 2023 highs.
However, Rekt Capital views this dip as healthy, setting AVAX up for the next uptrend back to the $65-$70 area over time. The analyst’s chart depicts AVAX’s price movements, showcasing various levels of support and resistance over time, highlighted by horizontal lines at different price levels.

Additionally, the chart includes horizontal colored lines representing support and resistance levels, where the price has historically not fallen below or struggled to rise above, respectively. A recent price action is highlighted, where AVAX appears to have broken above a resistance level but is encountering another resistance level at a higher price point.
The chart also features the label “29.96 (91.83%),” likely referring to a Fibonacci retracement or extension level, commonly used to predict potential reversal levels.
You may also be interested in:
- Jupiter (JUP) and Mantle (MNT) Prices Pumping – Here’s Why
- Solana (SOL) Price Eyeing All-Time Highs in April?
- Blast’s Dynamic Ecosystem: Leading 5 Innovations in DeFi and Gaming
We recommend eToro
Wide range of assets: cryptocurrencies alongside other investment products such as stocks and ETFs.
Copy trading: allows users to copy the trades of leading traders, for free.
User-friendly: eToro’s web-based platform and mobile app are user-friendly and easy to navigate.


