The biggest development for XRP in May was the big move in the resolution of Ripple’s long-running case with the U.S. Securities and Exchange Commission. On May 8, Ripple agreed to a $50 million settlement, officially ending the dispute and confirming that XRP is not considered a security in the U.S.
This legal clarity removed a major cloud over the project. It also reignited interest from institutional investors, especially as rumors began circulating that BlackRock and other major firms were in discussions with the SEC about launching an XRP spot ETF. Although the SEC delayed decisions on other ETF filings like Franklin Templeton’s, the door appears open for an XRP ETF before the end of the year.
Adding to the momentum was the appointment of Paul Atkins, a known crypto-friendly voice, as incoming SEC Chair. His views on digital assets have helped create a more supportive regulatory tone around Ripple and other crypto assets.
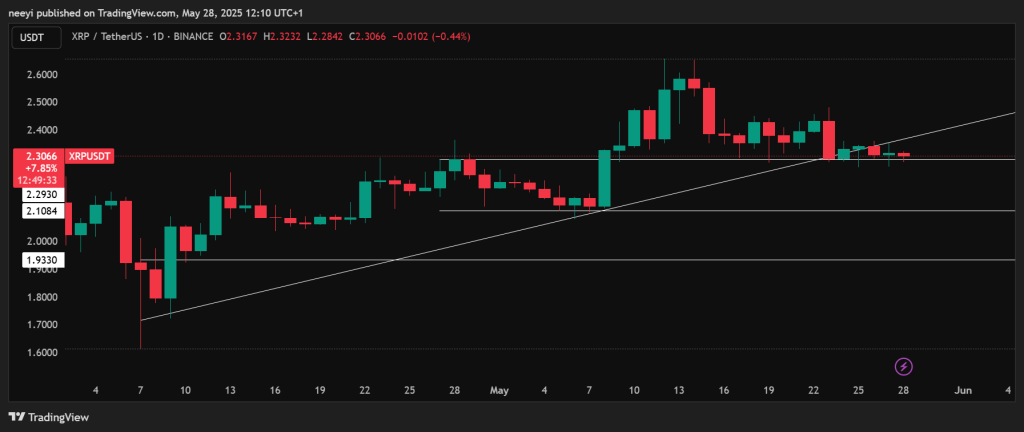
Ripple price spent most of May moving between $2.08 and $2.65. The price of Ripple (XRP) broke below a key trendline four days ago. Since then, it has been trading between $2.34 and $2.26. If it breaks below the key support around $2.29, we could see a decline to $2.10 and $1.93.
What you'll learn 👉
Technical Indicators: What the Charts Say About Ripple Price
Here’s a breakdown of what the major indicators on the daily chart from Investing.com are saying about XRP price:
| Indicator | Value | Implication for Price |
|---|---|---|
| Relative Strength Index (RSI 14) | 45.03 | Neutral. XRP is not overbought or oversold at this level. |
| Stochastic Oscillator (9,6) | 35.33 | Sell. Momentum appears weak, with potential downside risk. |
| MACD (12,26) | -0.005 | Sell. Bearish crossover suggests slowing upward momentum. |
| Average True Range (ATR 14) | 0.012 | Less volatility. XRP price may trade sideways near term. |
| Highs/Lows (14) | 0 | Neutral. No recent breakout or breakdown pattern confirmed. |
| Ultimate Oscillator | 54.71 | Buy. Mixed signals but short-term optimism exists. |
| Rate of Change (ROC) | -1.147 | Sell. Momentum is declining and bears are gaining ground. |
| Bull/Bear Power (13) | -0.0196 | Sell. Bears have more control right now than bulls. |
The overall sentiment from these indicators leans slightly bearish, with some hints of neutral behavior. The key takeaway is that XRP is lacking strong momentum in either direction.
Moving Averages Also Point to Weakness
All three major moving averages are flashing bearish signals:
- The 50-day moving average is hovering around $2.31 and signals a sell.
- The 100-day moving average is near $2.32, which also indicates a downward trend.
- The 200-day moving average at $2.35 further confirms the bearish sentiment.
When all the major averages show sell signals, it often means the asset is under downward pressure. For Ripple, these moving averages reflect the current struggle to break above resistance zones.
What Can Affect Ripple Price in June?
Several catalysts could play a major role in shaping Ripple price this month:
- Regulatory Developments: The SEC’s pending decision on Franklin Templeton’s XRP ETF could be a game-changer. Approval could bring institutional volume and bullish sentiment. Delay or rejection could hurt momentum.
- XSGD Stablecoin Launch: The rollout of the institutional phase of the XSGD stablecoin could drive utility and attention to the XRP Ledger.
- XRPL Apex Summit: From June 10 to 12, Ripple will host its developer summit, which might bring announcements around AI integration, DeFi, and cross-chain features.
- Macroeconomic Events: The Federal Reserve’s meeting on June 17–18 could affect the broader crypto market. Hawkish signals may reduce risk appetite.
XRP Price Prediction for June 2025
We asked chatGPT to give us XRP price prediction for June and it gave use these scenarios:
Bearish Scenario:
Ripple price drops toward $2.10 or even $1.93 if it breaks below the $2.29 support. This could happen if the ETF approval is delayed and macroeconomic signals remain negative. The technical charts currently lean slightly toward this direction.
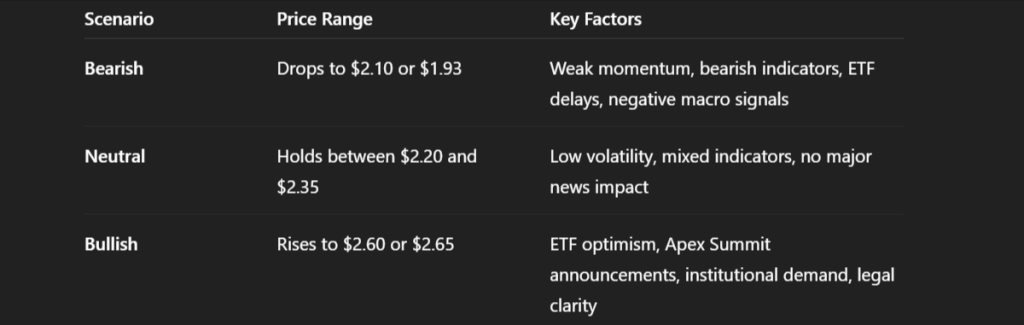
Neutral Scenario:
Ripple price trades sideways between $2.20 and $2.35 for most of June. Indicators suggest limited momentum and low volatility. In this scenario, news and events may be priced in, and investors wait for stronger signals.
Read Also: Kaspa (KAS) vs. SUI: Which Is the Better Crypto to Hold Right Now?
Bullish Scenario:
Ripple price rebounds toward $2.60 and retests the May high of $2.65. This would require strong institutional activity, positive news from the Apex Summit, or a surprise green light from the SEC regarding XRP ETFs.
Ripple price is currently at a critical level. The bearish sentiment from both the moving averages and momentum indicators suggests caution. But at the same time, legal clarity, ETF potential, and ecosystem developments could spark a mid-June rally if things align in Ripple’s favor.
Subscribe to our YouTube channel for daily crypto updates, market insights, and expert analysis.

We recommend eToro
Wide range of assets: cryptocurrencies alongside other investment products such as stocks and ETFs.
Copy trading: allows users to copy the trades of leading traders, for free.
User-friendly: eToro’s web-based platform and mobile app are user-friendly and easy to navigate.