After trading below $55 in mid-July, silver price is now recovering and is close to $64 as we open the new week. The metal has bounced pretty strongly from the July lows, reclaiming key support levels and pushing toward the $64 resistance zone.
The recovery comes as the broader precious metals complex shows strength. Gold is trading above $4,300, and silver is following suit. But one financial chart analyst, Northstar, just posted a very interesting silver price prediction and chart that has the community talking.
What you'll learn 👉
The Chart: A 50+ Year “Cup” Pattern
Northstar’s chart is a 2-month log scale view of silver spanning 1970 to 2026 , with projections drawn out to 2051. Current price sits at $63.30 , up 8.60% on the day shown.
The core structural claim is a 50+ year “cup” pattern. The chartist has drawn a rounded cup shape from the 1970s low through a trough around 1991–1993, framed by a long-term ascending trendline connecting the 1980 spike high area down to today.
This red trendline is labeled “the most important trendline of your investing lifetime” – a claim that silver is now breaking out of a multi-decade base and resistance line that has capped price since the 1980 Hunt Brothers spike.
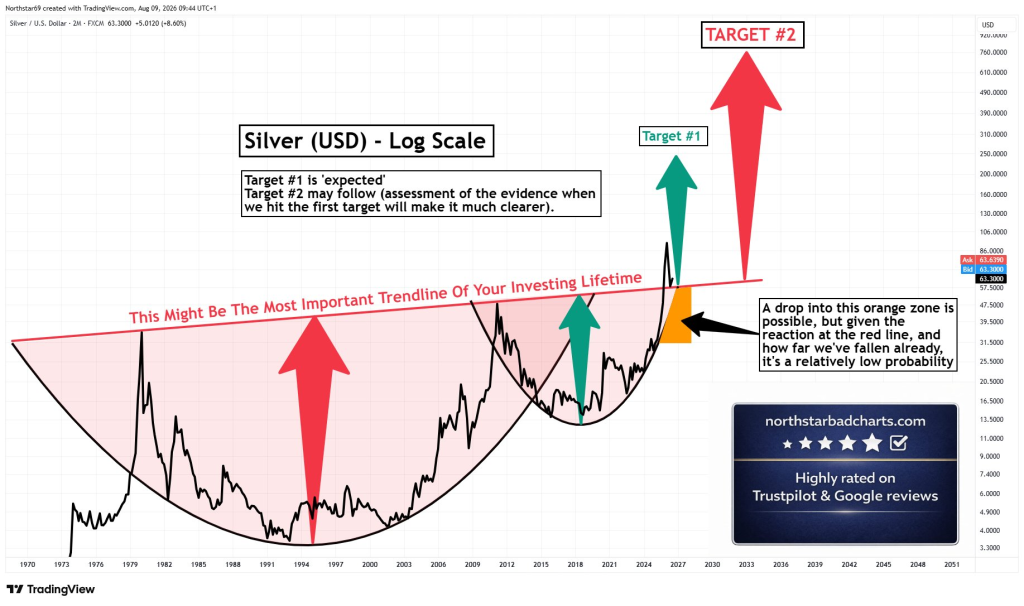
Recent price action: A basing pattern from roughly 2015 through 2020 was followed by a grind higher, then a big, near-vertical spike into 2026 that pushes price up to and through the descending red trendline. This is the “breakout” the chart is built around. An orange zone just below current price (~$50–55 range) is marked as a possible pullback and retest area.
The Targets: Speculative, Not Technical
Target #1 (teal arrow) points toward roughly the $250–260+ region, labeled as “expected” by the chartist.
Target #2 (red arrow) points toward a much higher, unlabeled level – the chart implies well above $750+ based on arrow length and placement – labeled as conditional: “may follow” pending confirmation at Target #1.
Neither target has a stated price level, timeframe, or methodology. No Fibonacci extension, no measured-move calculation is shown. These appear to be freehand projections based on the trendline breakout narrative rather than a calculated technical target.
Read also: Gold and Silver Prices Post Their Strongest Week in Months: What to Expect Next
Monthly Indicators: Mixed Signals
Additional monthly indicators pulled from Investing.com paint a mixed picture:
| Indicator | Value | Signal |
|---|---|---|
| CCI(14) | 1.8813 | Neutral |
| ATR(14) | 17.6289 | High Volatility |
| Highs/Lows(14) | 0 | Neutral |
| Ultimate Oscillator | 47.934 | Sell |
| ROC | 76.582 | Buy |
| Bull/Bear Power(13) | -2.345 | Sell |
The ROC at 76.582 signals buying momentum, consistent with the recent recovery. The Ultimate Oscillator at 47.934 flashes a sell signal, which indicates the rally may be overextended in the short term. ATR at 17.6289 confirms high volatility – silver remains a wild ride.
Northstar tweeted: “Silver – Possibly one of the most amazing set ups in my investing lifetime.”
The tweet shows the chartist’s conviction that silver is breaking out of a multi-decade resistance line. For a trader who has been in the markets for decades, that is a significant statement.
My Take: Respect the Pattern, Question the Targets
The long-term cup pattern on the 2-month chart is genuinely impressive. Silver has been basing for decades, and the breakout above the descending trendline is a legitimate technical event. If this is a genuine breakout from a 50-year resistance line, the upside potential is significant.
However, the $750 target is unrealistic. That would represent a roughly 1,000% move from current levels. Silver would need to rally more than 10x to reach that level. While silver has done similar moves in the past – the Hunt Brothers spike took silver from $6 to $50 in 1980 – those were driven by specific supply squeezes, not long-term trendline breakouts.
The $250–260 target is more plausible. Silver has been there before in nominal terms (the 1980 high was roughly $50, which adjusted for inflation is around $200–250 today). A move to $250 would represent a 4x rally from current levels. That is ambitious but not impossible.
The real question is timing. The chart does not provide a timeframe. A move to $250 could take years. The pullback zone around $50–55 is a realistic near-term scenario before any sustained rally.
Northstar is an experienced trader, and his long-term structural analysis is worth respecting. But the $750 target is more headline than analysis. I would treat the $250 target as the realistic upside case and the $750 as a speculative dream.
For now, silver is recovering nicely. The $64 level is the immediate resistance and let’s see if we can break this strongly today or later during the week.
Subscribe to our YouTube channel for daily crypto updates, market insights, and expert analysis.