
Binance Coin is back in focus after a long stretch of quiet consolidation, and the latest chart setup is starting to look familiar to those who have followed past cycles. BNB trades close to $620 at the time of writing, and price structure now sits near a zone that has historically acted as a turning point for major moves.
A closer look at the long-term chart shows a repeating pattern that could shape what comes next.
The chart reveals that BNB has moved through multiple accumulation phases since 2018, each followed by a strong expansion phase. Those accumulation zones formed after deep corrections, where price held above key Fibonacci levels and slowly built support.
The current setup mirrors those earlier cycles. Price spent months consolidating within a tight range before breaking out above resistance near the $700 region. That breakout level now acts as a reference point for market participants watching whether buyers can maintain control.
Crypto Patel has pointed out that previous accumulation ranges delivered strong returns once price moved higher. Data from past cycles shows gains of over 660% after the 2019 base and more than 11,000% during the 2020 to 2021 expansion phase.
That historical context adds weight to the current structure.
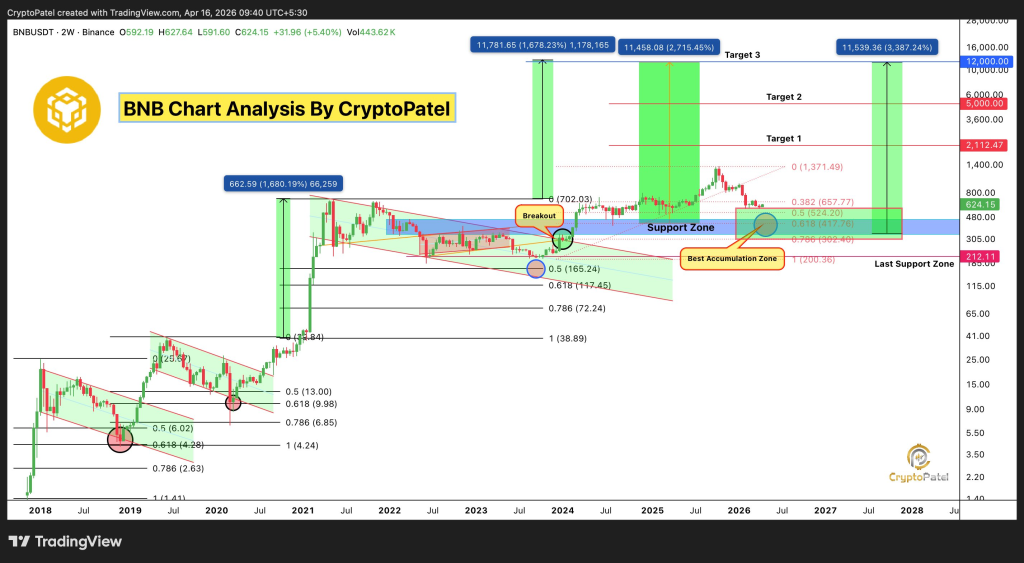
Support Zone Between $300 And $500 Remains Key For BNB Price Stability
The chart highlights a strong support zone between $300 and $500. That region aligns with key Fibonacci retracement levels, including the 0.5 and 0.618 zones, which often act as decision areas in long-term trends.
Price recently moved above this zone and is now testing higher levels. As long as BNB stays above this support band, the broader structure remains intact.
Crypto Patel has described this region as the “best accumulation zone,” based on how previous cycles behaved. Each revisit to similar zones in the past created opportunities before large upside moves followed.
That pattern does not guarantee a repeat, though it provides a framework for understanding market behavior.
BNB Price Targets Point To $2,000, $5,000, And $10,000 Levels
The projection zones on the chart outline potential upside targets at $2,000, $5,000, and $10,000. These levels come from measuring previous expansion phases and applying them to the current cycle structure.
Crypto Patel believes that a similar expansion could unfold between 2026 and 2027 if the structure holds. His projection includes a possible 1,000% move from accumulation levels, which would align with historical patterns.
Price has already shown a move of over 500% in the current cycle from its lows, which keeps the broader trend intact.
Read Also: Ethereum (ETH) Price Is Close to a Full Bullish Reversal But One Level Still Matters
The breakout zone near $700 remains critical. Price briefly moved above that level before pulling back, which often happens during early breakout attempts.
If BNB reclaims and holds above that range, the market could enter a stronger expansion phase. Failure to hold that level could send price back toward the support zone for another test.
That decision point often defines whether a trend continues or pauses.
Subscribe to our YouTube channel for daily crypto updates, market insights, and expert analysis.