The XRP price has been moving quietly for months, but one chart now does look interesting for traders. CryptoBull shared a setup that indicates XRP could be preparing for its next major impulse move, and the structure he points out is not something bears would like to see.
The idea is simple. XRP’s current price pattern is starting to resemble the one that formed before its last major bull run. The main difference is time. This cycle has taken longer, which usually points to deeper accumulation and, potentially, larger moves once price breaks out.
Let’s walk through what the chart is actually showing.
What you'll learn 👉
XRP Chart: A Familiar Structure
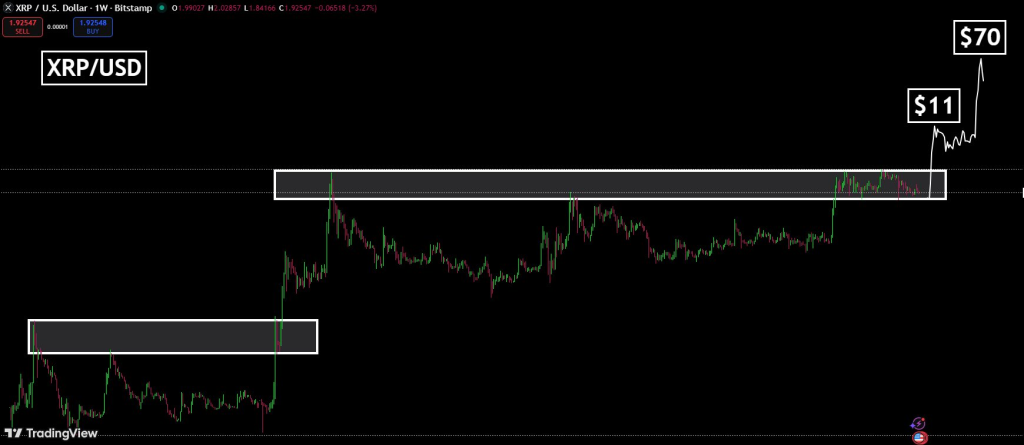
On CryptoBull’s chart, the XRP price is moving inside a wide consolidation zone that has acted as both resistance and support over time. Price spent a long period compressing in this range, similar to what happened before XRP’s explosive move in the previous cycle.
Back then, XRP built a base for months before breaking higher in a sharp vertical rally. The current structure looks slower and more drawn out, but the shape is familiar. Long, flat ranges followed by a sudden expansion.
This kind of pattern usually signals that supply is being absorbed gradually. Sellers become less aggressive, and buyers gain control without forcing price higher too early.
That slow absorption phase is often what makes the breakout move violent once it finally happens.
Why $11 Is the First Key Level for the XRP Price
CryptoBull marks $11 as the next major impulse target. That number is not random. It sits in the area where XRP last showed strong reaction during its historical run, making it a natural magnet once price escapes its current range.
The logic here is not that XRP goes straight to $70 overnight. Instead, the chart indicates a two-stage move.
The first wave aims toward $11 as the initial expansion from accumulation. That move alone would already represent a massive shift from current price levels and would likely change sentiment across the entire market.
Only after that would the final phase toward higher targets even become relevant.
Read also: Everyone Is Dumping XRP, But Bears May Be Walking Into a Perfect Trap
The Case for $70: Why Time Matters
CryptoBull also points to $70 as a long-term target based on the full pattern projection. That sounds extreme, but the reasoning is rooted in how markets scale moves when accumulation takes longer.
The longer a market stays compressed, the more energy builds up. When price finally breaks free, the move often travels further than many expect.
This is why CryptoBull highlights time as the key difference between now and the last bull run. The XRP price is building slower.
That slower build could mean fewer weak hands and stronger positioning among long-term holders.
Why XRP Bears Are in a Risky Spot
From a bearish perspective, this is an uncomfortable structure.
Price is not breaking down. It is not making lower lows. Instead, it is holding a range and tightening inside it. That kind of behavior usually signals indecision turning into directional expansion, not collapse.
If bears were truly in control, XRP would already be bleeding through support zones. Instead, it keeps bouncing within its base.
That does not guarantee a breakout, but it makes aggressive short positions harder to justify.
Every chart pattern needs a clear failure point.
For CryptoBull’s scenario to stay valid, XRP must hold above its lower consolidation range. A breakdown below that zone would invalidate the accumulation narrative and open the door to a deeper correction.
As long as that does not happen, the structure remains neutral-to-bullish, even if price stays boring in the short term.
Read also: XRP Funding Rate Dips on Binance: How Low Could Price Go This Time?
Subscribe to our YouTube channel for daily crypto updates, market insights, and expert analysis.