As XRP price pushes toward the $2 mark, a fresh price forecast is drawing strong reactions across the crypto community. Trading at $1.99 with a 12% gain over the past day, the token’s recent move is being matched by an even more aggressive projection from a well-followed market analyst.
Prominent analyst EGRAG CRYPTO, with over 80,000 followers on X, believes XRP price could climb as high as $30 in the current market cycle. The forecast isn’t based on speculation alone, but rather on a detailed chart pattern combined with historical data from XRP’s 2017 rally.
What you'll learn 👉
XRP Technical Chart Suggests a Symmetrical Triangle Breakout
A symmetrical triangle pattern has been forming on the XRP monthly chart, stretching from 2018 through 2025. According to the chart, XRP price is nearing the apex of this triangle. Typically, this pattern represents a consolidation period that can precede a breakout.
The chart compares the current structure with the 2017 price movement, during which XRP surged over 2,600%. This previous rally took the price of XRP from approximately $0.12 to $3.32.
Based on that historical move, the chart suggests that if a similar breakout occurs from around $1.20, XRP could reach targets as high as $32.36. Fibonacci extension levels reinforce several resistance zones along the way, including $7.88, $10.06, and $28.04.
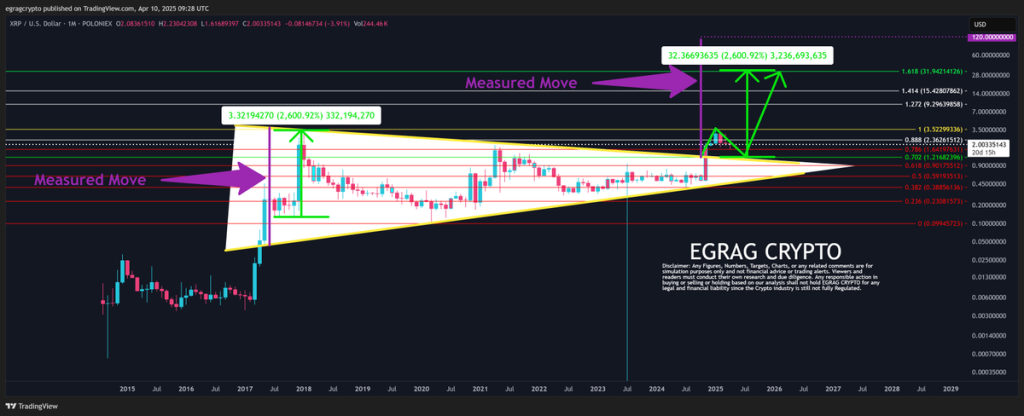
Projected XRP Price Levels Based on Historical Data
The first target in the analysis is set at $3.32, marking a retest of the all-time high. The second target extends to $32.36, reflecting the potential 2,600% increase from the projected breakout point. The chart also outlines support levels at $0.72, $0.52, and $0.30, derived from Fibonacci retracement zones. These may serve as key levels if the price of XRP pulls back before any continuation.
A secondary retracement model within the chart suggests that XRP could initially spike, return to the breakout zone near $1.20, and then rally toward higher targets. This aligns with traditional bullish continuation patterns in technical analysis.
Read Also: Pro-XRP Attorney Flags April 16 as Key Date in Ripple vs SEC Case – What to Expect
Conceptual Model Reinforces XRP Price Breakout Potential
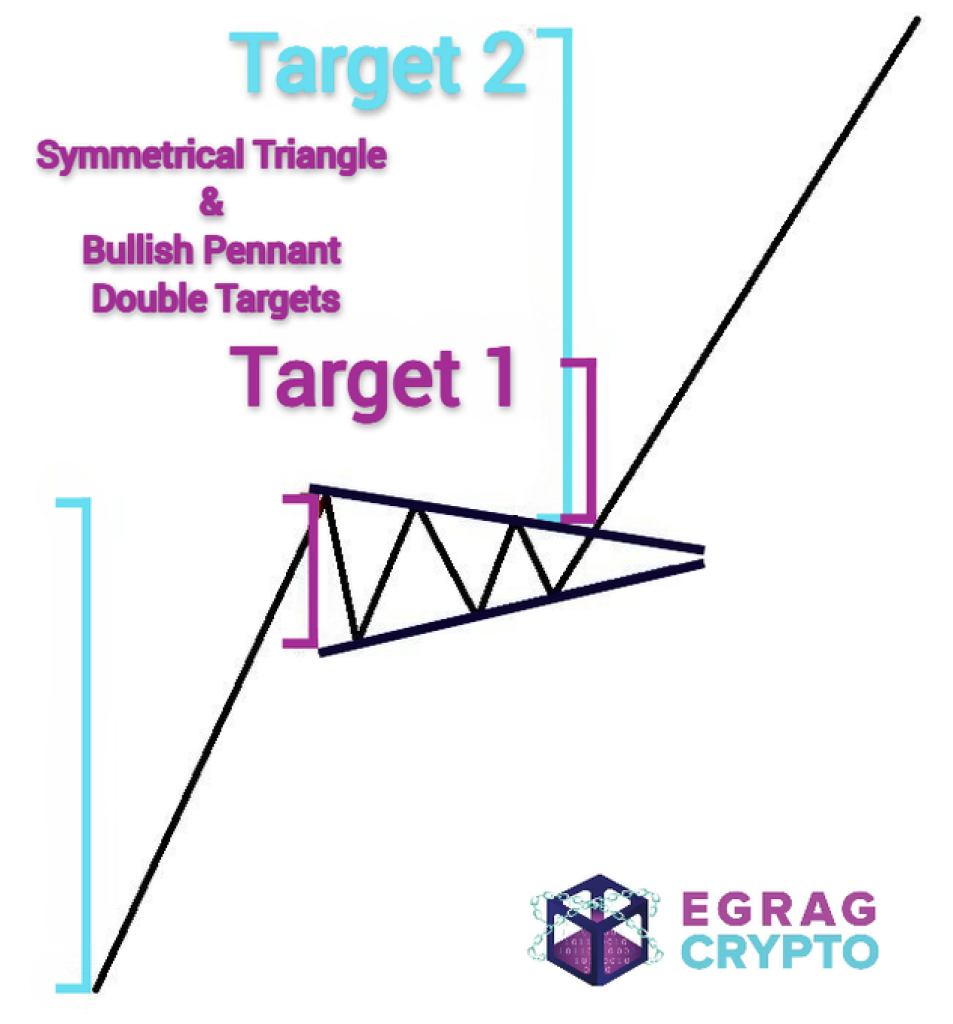
The supporting schematic illustration posted by EGRAG Crypto visualizes a breakout from a symmetrical triangle with two upward targets. The first reflects the triangle’s height, while the second considers the length of the prior rally. This conceptual model supports the hypothesis that XRP could generate a large-scale move if momentum aligns with the current pattern.
The structure mirrors both a symmetrical triangle and a bullish pennant, suggesting continuation rather than reversal. The chart highlights the possibility of achieving two breakout targets through measured moves.
Moreover, in the tweet shared by EGRAG CRYTPO, the analyst states: “Let’s focus on this cycle for the breakout from the symmetrical triangle. Instead of using the triangle’s measured move, I’m looking at the last pump from the 2017 cycle, which was an incredible 2,600%!”
The tweet positions the $30 target not as speculation but as a repeat of XRP historical price movement. The post ends with the phrase “Men lie, women lie, but charts don’t lie,” reflecting confidence in the pattern-based approach.
The projection is rooted in previous behavior and current formations but depends on market structure, volume, and broader conditions.
Subscribe to our YouTube channel for daily crypto updates, market insights, and expert analysis.

We recommend eToro
Wide range of assets: cryptocurrencies alongside other investment products such as stocks and ETFs.
Copy trading: allows users to copy the trades of leading traders, for free.
User-friendly: eToro’s web-based platform and mobile app are user-friendly and easy to navigate.