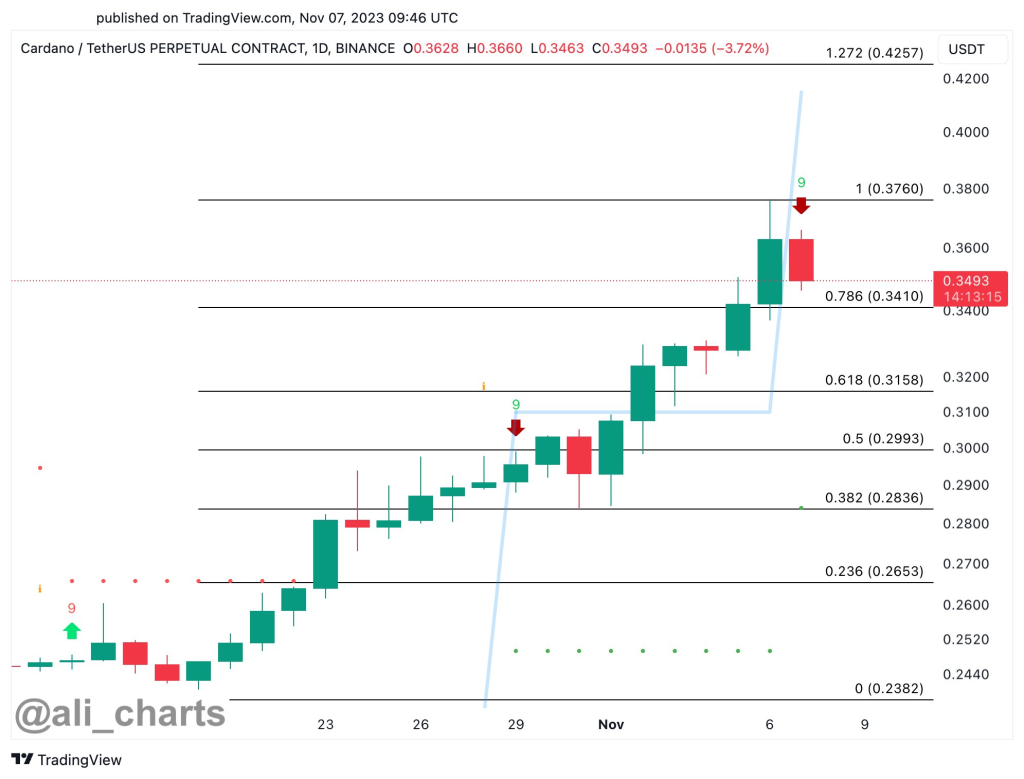
The Cardano price has seen bullish momentum in recent days, jumping from around $0.29 to $0.35 last week. However, analyst Ali posted on X (Twitter) that the TD Sequential indicator is presenting a sell signal on the ADA daily chart.
This technical indicator anticipates a correction that could bring Cardano back down to test support around $0.30.

However, looking at other metrics paints a different picture for ADA’s near-term outlook. The relative strength index (RSI) on the daily chart is currently sitting at 36. An RSI below 30 is considered oversold territory, while a reading above 70 is deemed overbought.
With the RSI at 36, this suggests ADA is neither oversold nor overbought at current levels. This means there is room for the price to continue trending higher despite the bearish TD Sequential signal.
Moreover, key on-chain metrics are pointing to further potential upside for Cardano. Transaction volumes have been robust, with over 6,700 whale transactions valued at $1 million or higher taking place between November 2nd and November 6th. Rising network activity and interest from large investors are typically positive indicators for a cryptocurrency’s price.
While technical factors may be signaling a short-term pullback, the overall on-chain and market conditions appear favorable for the Cardano price to see additional gains. The RSI shows room for more upside, and whale activity remains strong. As such, dips could provide buying opportunities for ADA bulls expecting the uptrend to continue. Traders should watch for a daily close below $0.30 to negate the bullish outlook.
We recommend eToro
Wide range of assets: cryptocurrencies alongside other investment products such as stocks and ETFs.
Copy trading: allows users to copy the trades of leading traders, for free.
User-friendly: eToro’s web-based platform and mobile app are user-friendly and easy to navigate.


