XRP, the fifth largest cryptocurrency by market value, could be on course for its first week of losses since October as the price fell below $0.60 today.
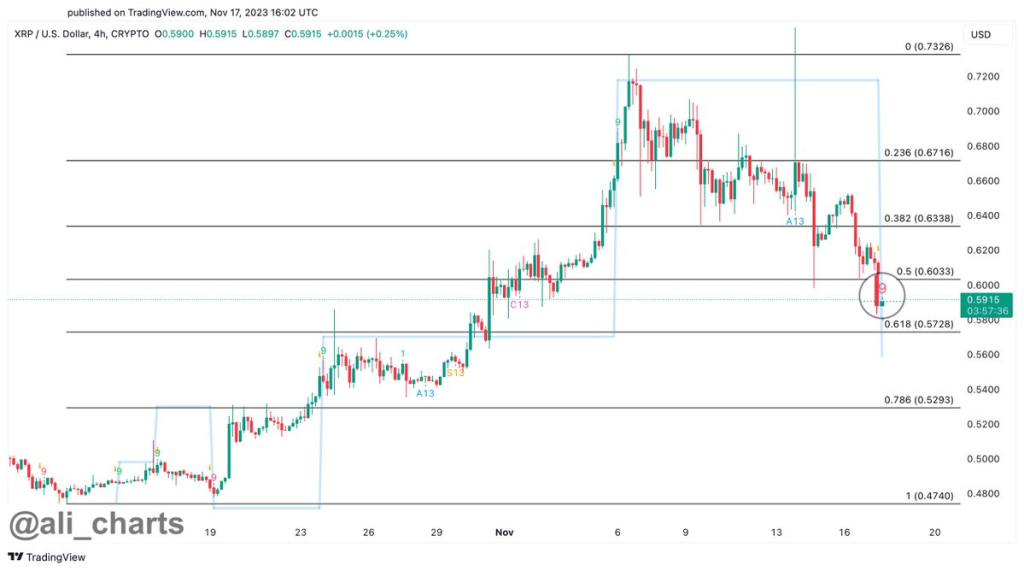
Popular crypto analyst Ali on social media platform X (Twitter) posted that the TD Sequential indicator shows a buy signal on the 4-hour XRP chart, which could trigger a rebound to $0.63 or even $0.67.
However, XRP was trading around $0.61 at the time of writing, down from highs of $0.75 last seen in the beginning of November.

The Relative Strength Index (RSI) on the daily chart is 55. RSI is a momentum indicator that measures the magnitude of recent price changes to evaluate overbought or oversold conditions. A reading of 55 indicates neutral momentum and no clear direction for XRP’s price.
XRP embarked on a sharp run up starting in mid-October, rising for four consecutive weeks to reach multi-month highs of $0.75 earlier this week. However, sell orders kicked in and sent the price tumbling lower. This liquidated many leveraged long positions and drove the price down further.
The rumor of a BlackRock exchange-traded fund (ETF) focused on XRP had initially boosted the price 12% to $0.75 on November 13. However, the report was later discredited, causing XRP to quickly fall back from its peak. The pump and dump around the BlackRock ETF rumor was a key catalyst for XRP’s steep price decline throughout the week.
With XRP down three out of the last four days, it is on pace to post its first week of losses since October. However, analysts will be watching to see if the buy signal on the 4-hour chart noted by Ali will spark a rebound in the coming days.
We recommend eToro
Wide range of assets: cryptocurrencies alongside other investment products such as stocks and ETFs.
Copy trading: allows users to copy the trades of leading traders, for free.
User-friendly: eToro’s web-based platform and mobile app are user-friendly and easy to navigate.


