For those wondering if Cardano (ADA) still has the ability to surprise the market with explosive growth, a chart might shift your perspective.
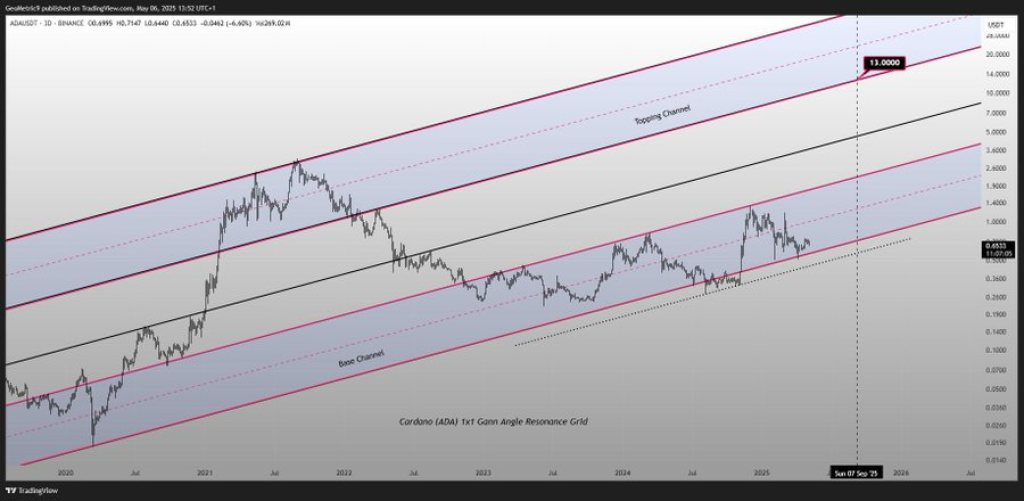
ADA’s price action has been following a long-term geometric path with surprising accuracy, and if it continues respecting this pattern, the upside could be massive. A projected target of $13 puts the potential return at around 18 times the current price, which hovers near $0.45.
This chart posted by GeoMetric uses something called a Gann Angle Resonance Grid. It’s a technical tool that maps out angled channels based on price and time. What’s striking here is how Cardano price movements have followed this grid for years, almost like they were drawn to these invisible lines.
From the 2020 breakout to the 2021 bull run, and through the 2022 and 2023 consolidations, ADA has moved within these channels with remarkable precision.
What you'll learn 👉
How the Grid Frames ADA Price Movement
The chart is divided into several key zones. At the bottom, there’s the base channel, a gentle upward slope where ADA spent its early days consolidating and growing. Then comes the broader middle channel, outlined in red, which contains the 2021 peak and most of the current market cycle. This is where ADA has been bouncing around lately, signaling a potential build-up before a bigger move.
At the very top sits the so-called topping channel. That’s where the real excitement begins. If ADA manages to break out of its current zone and climb into that upper space, the chart points toward a possible $13 target. That’s the level GeoMetric, the analyst who posted this chart on X, highlights as the ceiling of the Gann grid.
GeoMetric’s Take on ADA’s Growth Potential
GeoMetric explains that ADA has one of the cleanest, most well-behaved long-term patterns among altcoins. In his words, the Gann angle resonance grid “shows how beautifully price has been trading along the grid over a long time.” For him, that’s a strong sign of structure and reliability. This isn’t just random movement. It’s a visual history of price respecting long-term mathematical geometry.
According to GeoMetric, if Cardano price pushes into that top channel, it could multiply current levels by 18 times. That’s not just wild speculation. The math works. From $0.45 to $13, the gain is right in that range.
Read Also: AI Predicts How High ADA Price Could Climb If Cardano Powers Bitcoin DeFi
The chart doesn’t predict the future with certainty, but it does offer a structured path for where ADA could go. Cardano is still trading within a long-term upward grid and hasn’t broken beneath its foundational support. If it continues moving in harmony with this pattern, there’s a real chance it could climb toward levels that many have stopped believing in.
So before writing off ADA’s potential, it might be worth looking at the long view—because this chart suggests that Cardano still has plenty of room to run
Subscribe to our YouTube channel for daily crypto updates, market insights, and expert analysis.

We recommend eToro
Wide range of assets: cryptocurrencies alongside other investment products such as stocks and ETFs.
Copy trading: allows users to copy the trades of leading traders, for free.
User-friendly: eToro’s web-based platform and mobile app are user-friendly and easy to navigate.