

SUI price pushed back above the $1 level this week, and that move has brought renewed focus to a setup that many had already written off earlier in the year. The recovery did not come out of nowhere. Price respected a key support zone near the lower Fibonacci levels and bounced from a long term trendline that has been guiding the structure since early cycles.
That reaction reveals something important about market structure. Buyers stepped in at a point where previous pullbacks had also found support, and the chart now shows a familiar pattern that traders have seen before.
A closer look at the SUI chart shows that the 0.786 Fibonacci retracement level near $0.77 held firmly during the recent decline. Price dipped into that zone, tested it, and quickly recovered. That level often acts as a final line of defense in trending markets, and the reaction confirms that buyers still defend the structure.
The same area also aligns with a rising macro trendline that has been respected across multiple cycles. That confluence created a strong base, and once price reclaimed $1, the structure started to look more constructive again.
Crypto Patel has pointed out that this exact setup played out before during the 2024 cycle, where a similar bounce led to a move of over 1000%. His analysis shows that the current structure mirrors that previous pattern, and he believes the chart still follows that fractal.
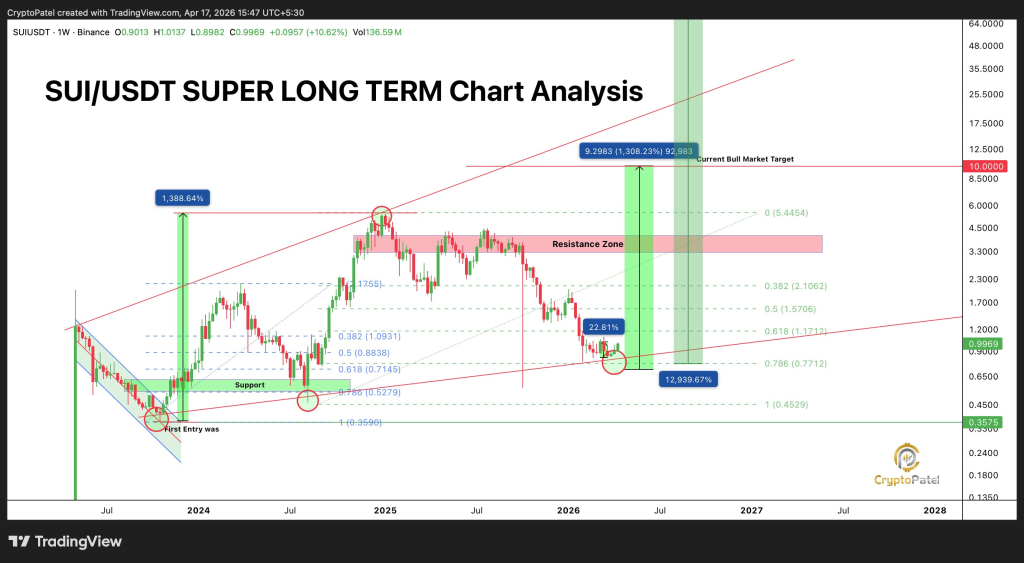
Resistance Zone Near $4 Remains The Next Major Test For SUI Price
The chart clearly shows a resistance zone between $3 and $4, where price faced rejection in earlier rallies. That area now becomes the next key level to watch as SUI price attempts to build upward momentum.
Crypto Patel explained that reclaiming $1 was part of the broader plan, and he outlined potential targets at $2, $5, $10, and even $20 if the structure continues to hold. Those targets align with the measured move shown on the chart, which projects a possible upside move of over 1300% from the recent lows.
Read Also: Cardano’s Founder Warns: Bitcoin Quantum Plan Won’t Save ALL BTC
Another detail stands out. The chart highlights a previous rally of over 1300% during the early phase of the cycle, and the current setup appears to follow a similar trajectory. That comparison adds weight to the idea that this phase could represent the early stage of a larger move.
SUI Price Structure Suggests Early Cycle Positioning Instead Of Late Stage Exhaustion
The current structure does not resemble a late stage rally where price extends far beyond support levels. Instead, the bounce occurred from a deep retracement area, which often marks the beginning of a new cycle rather than the end.
Crypto Patel has emphasized that cycles tend to start when sentiment remains cautious, not when excitement reaches extreme levels. The recent pullback and recovery fit that pattern, as price reset before showing signs of strength again.
Read Also: Here’s Exactly Why Kaspa Price Is Pumping Right Now
The next few weeks will likely determine whether SUI price can break into the resistance zone and hold above it. A clean move above $4 would confirm strength, while failure at that level could lead to another consolidation phase.
Subscribe to our YouTube channel for daily crypto updates, market insights, and expert analysis.


