Stellar’s (XLM) Trading Ranges: A Path to Stability? & Bitcoin Cash’s Market Dynamics: A Downtrend in Sight?
As an experienced observer of the crypto market’s ebbs and flows, it’s clear that the Stellar (XLM) is currently exhibiting some intriguing patterns.
The blue boxes on the chart, markers of previous price strength, are particularly noteworthy. These areas have shown resilience in the past, and their presence now suggests potential zones of interest for traders.
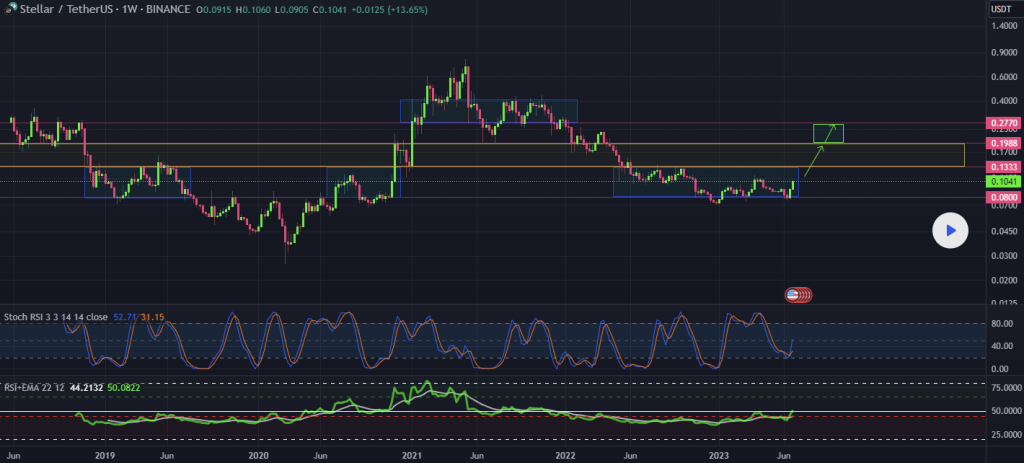
The trading range highlighted in the yellow box, however, is showing signs of weakness. This could be a cause for concern, or an opportunity for those looking to enter at a lower price point. The upper blue box, with its history of stronger price action, could serve as an initial resistance level. This is a key area to watch, as breaking through this resistance could signal a shift in the market’s sentiment towards XLM.
Doge2014 raises 500K in days celebrating Dogecoin. Make potentially big profits and get in on exclusive airdrop!
Show more +Currently, there’s a noticeable strength in the accumulation phase. The price appears to be adhering to a solid range, which could act as future support. This stability is a positive sign, suggesting that the market is finding value at these levels.
Two green arrows on the chart indicate potential resistance points if we break out of the current range. These are critical junctures that could determine the future trajectory of XLM. A break above these points could signal a strong bullish trend, while failure to surpass them might indicate a continuation of the current range-bound trading.
As always, it’s important to remember that the crypto market is highly volatile and subject to rapid changes. This analysis provides a snapshot of the current market conditions, but traders should always conduct their own research and stay updated on market news.
The XLM/USDT trading pair is presenting some interesting opportunities for traders. With clear areas of support and resistance identified, the stage is set for some potentially significant price movements. As the market continues to evolve, keeping a close eye on these key levels will be crucial in navigating the Stellar path.
Bitcoin Cash (BCH): A Deep Dive into Current Market Dynamics
Bitcoin Cash (BCH) has been making waves with its recent price movements. A detailed analysis of BCH’s price trends reveals a fascinating interplay of market forces and investor sentiment.
The larger picture shows that BCH is likely in an overall downtrend, having peaked in 2021 in a clear three-wave move. Since then, the price has been dropping, making it challenging to count it as a one-two setup. However, there’s a possibility that BCH is in the midst of a larger diagonal structure, where each wave is an ABC structure. This scenario, while not the primary expectation, could lead to new highs, albeit in a choppy and unpredictable manner.
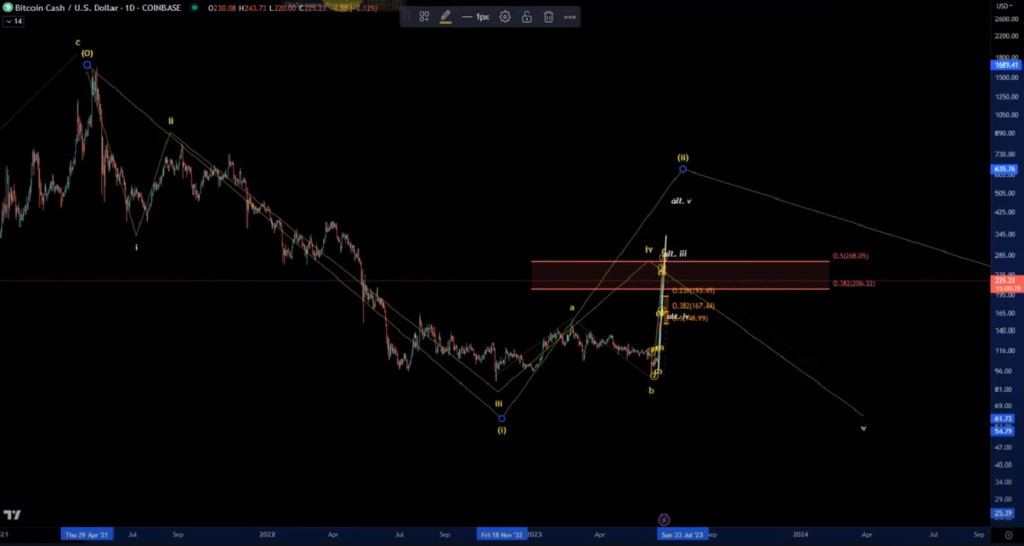
Currently, BCH is pulling back in a corrective fashion in a three-wave move. The resistance area, which is between $149 and $193, is a crucial zone to watch. If the price holds above $149, it could push higher. However, if it breaks below $149, it would likely indicate a three-wave top in an ABC correction, leading to a new low.
The recent break of the trend line is a significant warning sign of potential declines. If BCH breaks below the last swing low at $213, it could quickly drop into the orange support area. However, if it pushes above today’s high at $244, it could extend the current upward move.
Bearish divergences on the four-hour and daily charts also suggest that BCH might be heading for a downturn. However, until there’s a lower low and a lower high, the trend reversal isn’t confirmed.
In conclusion, BCH is at a critical juncture. The break of the trend line and the bearish divergences are warning signs of potential declines. However, if BCH can hold above key support levels, there’s a chance for further upside. As always, investors should keep a close eye on these key levels and stay updated on market news. The world of cryptocurrency is highly volatile, and BCH is no exception.