Silver just delivered one of its sharpest short-term reversals in weeks. After pushing toward the mid-$90s, price collapsed back toward the $85 zone in a violent move that caught late buyers off guard.
Rashad Hajiyev, a well-known financial analyst on X who has been openly bullish on silver, shared a chart arguing that the drop was a textbook shakeout. His view is clear: weak hands got flushed, stops were triggered, and the market may now be positioned for a rebound.
Let’s break down what his silver chart is actually showing.
What you'll learn 👉
The Broadening Wedge and the 2-Week Support Zone
Hajiyev’s chart shows a rising broadening structure that had been developing for roughly two weeks. Price was climbing within an expanding formation, making higher highs and higher lows, but volatility was increasing.
The key level on his chart is the horizontal support around $85–$86. That level acted as the floor of the recent structure. Many short-term traders who entered silver during the geopolitical headlines likely placed stop losses just below this clearly visible support.
What happened next fits a familiar pattern:
- Price spiked lower
- Stops below support were triggered
- Liquidity was absorbed
- Price quickly stabilized near the same zone
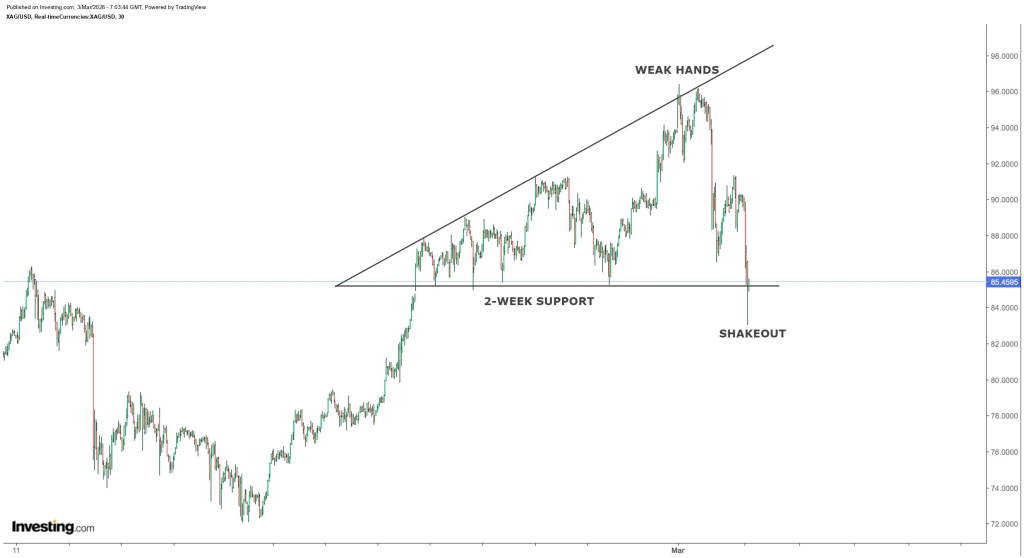
On the chart, this is labeled as a “shakeout.” The idea is simple; force emotional traders out of positions before the next move higher. The decline pierced the level just enough to create fear, then held.
From a structural perspective, the bigger trend remains intact unless silver decisively breaks and closes below that zone on higher timeframes.
Weak Hands vs. Structural Buyers
Hajiyev’s tweet focuses on psychology as much as structure. He argues that many participants bought silver during the war-driven pump near the highs. Those late entries were highly sensitive to drawdowns. A 10–14% pullback from the local top is enough to shake out traders who entered for momentum, not conviction.
The silver chart shows the upper trendline where “weak hands” likely chased the breakout. Once momentum stalled and the market reversed sharply, the same traders became forced sellers.
The important point is how it dipped.
The move lower was fast and vertical, suggesting stop cascades and forced liquidation. It was not a slow grind with expanding distribution. That distinction matters. Panic-driven drops often retrace quickly once selling pressure exhausts.
Hajiyev’s stance is that the flush clears the deck. Fewer participants remain positioned on leverage. If silver regains momentum from this support area, the rebound could be sharp, mirroring the speed of the decline.
Read also: ChatGPT Predicts the Price of Silver and Gold If the U.S.–Iran War Escalates Further
Silver Short-term Price Forecast: What Happens Next?
If silver holds above the $85 region and begins reclaiming the $90 area, the structure supports a renewed push toward the prior highs near $95–$97. A clean breakout from there would reopen the path toward the $100 psychological level.
However, if silver loses $85 decisively and fails to reclaim it, the shakeout thesis weakens. That would open the door for a deeper retracement toward lower demand zones.
For now, the chart indicates one thing clearly: a high-volatility flush just occurred at a clearly defined support level.
Subscribe to our YouTube channel for daily crypto updates, market insights, and expert analysis.