Silver Price Alert: Patience Running Out as Consolidation Nears 4 Weeks – $83 Target Still Alive

Silver continues to move sideways around the 75.36 area, according to a tweet and 4-hour chart analysis from “EconomicOffice.” The analyst notes that the 83 target remains on the table for silver. Key support levels at 72.20 and 70.86 are critical.
If this zone holds, a rebound could create room for a new move toward the $83.05 resistance area.
Let’s break down the silver chart in detail, then look at the catalysts that could drive silver’s next move.
What you'll learn 👉
Chart Analysis – 4-Hour XAG/USD
The attached 4-hour chart from OANDA shows a well-defined structure of support and resistance zones. Current price: ~$75.36, with price compressing between $74 and $76 over the past several trading sessions. The overall trend is sideways, with lower highs since the peak near 89 in early May.
Resistance levels (marked on chart): Several horizontal lines are labeled “Resistance.” The most immediate resistance is near $76.00-$76.50, then $78.00, $80.00, and finally the target at 83.05. The area around 89-$92 is marked as a major resistance zone from previous highs.
Support levels: The chart shows multiple support lines. The first strong support is at $72.20, followed by $70.86. Below that, additional support sits at $69.50 and $68.00, with a final major support around $66.93.
These levels have been tested and held during the recent pullback. Structure: The 4-hour chart reveals a descending triangle or a sideways channel that began after the rejection from 89 in early May. Price is currently hovering near the lower end of the range, close to the 72-$75 support cluster.
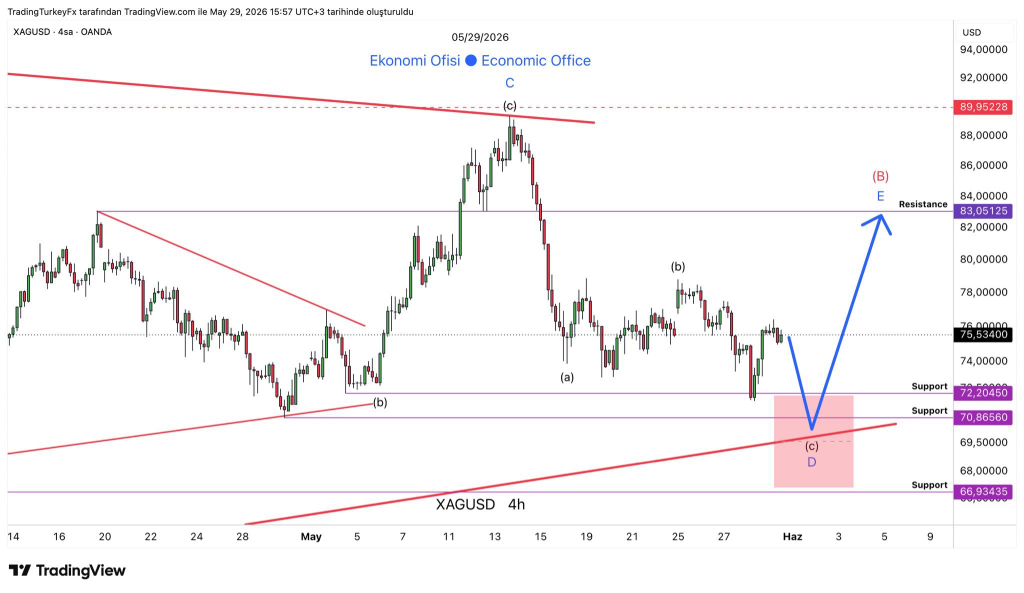
The Bollinger Bands (not explicitly drawn but visible from the price action) appear to be contracting, indicating low volatility and a potential squeeze. The annotation on the chart shows a series of waves labeled (a), (b), (c), and a final “D” – likely an Elliott Wave count indicating the correction may be nearing completion. Volume and momentum: The recent candles show decreasing volume, typical for consolidation.
RSI (not shown on this chart but known from previous data) is likely near 45-50, neutral. The analyst’s key message is that as long as the $72.20-$70.86 support zone holds, the bullish structure remains intact. A rebound from this area could push silver back toward the $83.05 resistance, which has been a target since earlier in the year.
Catalysts to Watch for Silver
For silver right now, the main drivers are supply tightness, ETF and speculative flows, Chinese demand, and policy or margin changes. These factors are most directly tied to the recent spike and sharp pullbacks.
Physical supply deficit and tight liquidity – Silver is in its sixth consecutive year of supply deficit. Industrial demand (solar, EVs, electronics) continues to outpace mine production. Above-ground inventories are being drawn down.
This structural deficit underpins any bullish scenario. ETF inflows and investor positioning – Silver ETFs have seen volatile flows. Leveraged longs can amplify both rallies and selloffs.
Record silver imports and strong industrial consumption have provided a floor. Any stimulus or infrastructure spending in China could further boost demand. Margin requirement changes and exchange rules – The CME and other exchanges can adjust margin requirements for silver futures.
A reduction in margins can encourage new buying; an increase can trigger forced selling. These rule changes have historically caused abrupt de-risking events.
Read also: Robert Kiyosaki Makes Shocking Silver and Gold Price Predictions for 2026
Where Could Silver Price Go Next?
The immediate short-term silver price outlook is neutral to slightly bullish. Silver has held the $72-75 support zone after two tests. A daily close above $75.50 would signal that the rebound is gaining traction, with the first target at 78, then 80, and eventually the 83 resistance.
The 4-hour chart’s contracting range suggests that a breakout is imminent – the longer silver compresses, the more violent the eventual move. If the $72.20 support fails, the next stop is $70.86. A break below that would open the door to 68-69, and potentially a retest of the $66.93 low from March.
That bearish scenario would likely be triggered by a sharp dollar rally, further ETF outflows, or a surprise Fed rate hike. Given the current geopolitical backdrop (Iran tensions) and sticky inflation, the risk of a deeper correction cannot be ignored.
For traders, the key is to watch the $72.20-$70.86 zone. Holding above it keeps the $83 target alive. A breakdown would invalidate the bullish setup.
For longer-term investors, silver remains undervalued relative to gold (gold-silver ratio near $85) and the supply deficit continues to widen. Accumulating near $72-$75 for a multi-quarter hold is a reasonable strategy.
Analyst “Economic Office” maintains that the $83 target is still on the table. With the right catalyst – a Fed pivot, a ceasefire reducing oil prices, or a surge in Chinese industrial demand – silver could revisit that level in June or July.
FAQs
Subscribe to our YouTube channel for daily crypto updates, market insights, and expert analysis.