Silver Price Alert: 522M Paper Ounces vs. 75.7M Registered – Here’s Why That’s a Warning Signal
The silver price might look fairly normal at a glance, but there’s something deeper going on underneath. The moves on the chart don’t fully line up with what’s happening in the background, and that’s starting to catch attention.
The real focus right now is the gap between paper silver and actual physical supply. When that gap gets this wide, it raises questions about how stable the current setup really is, especially if demand for real metal starts to pick up.
What you'll learn 👉
A Growing Imbalance in the Silver Market
One of the more interesting takes comes from Sir. Silver Quack, who pointed out that the silver price has been moving up even as open interest drops. That’s not the usual pattern you’d expect in a strong rally.
At the same time, the numbers are hard to ignore. There are about 522 million ounces in paper contracts compared to just 75.7 million ounces of registered silver. That doesn’t automatically break anything, but it does create a fragile setup if too many participants start asking for delivery.
What makes this more interesting is how the market reacts in that kind of environment. When supply is tight and positions are concentrated, price moves can become less stable and more reactive.
Why This Setup Feels Different
Normally, when the silver price moves higher, you’d expect to see more traders getting involved. That’s not happening here. Participation is actually thinning out, which changes how the market behaves.
Instead of fresh demand pushing price up, it looks more like positions are being adjusted and shorts are being forced to react. That kind of movement can accelerate quickly, especially if liquidity on the sell side starts to dry up.
The bigger concern is what happens if delivery demand increases. When paper claims heavily outweigh available supply, the market can stop acting like a smooth trading system and start reacting to actual availability.
What the Silver Price Chart Is Showing
We had a look at the silver chart, and the structure is a bit mixed right now. Earlier this year, the silver price made a strong move from around $66 up to nearly $96. That rally didn’t last long though, as momentum faded and a sharp drop followed, bringing price down into the low $60s.
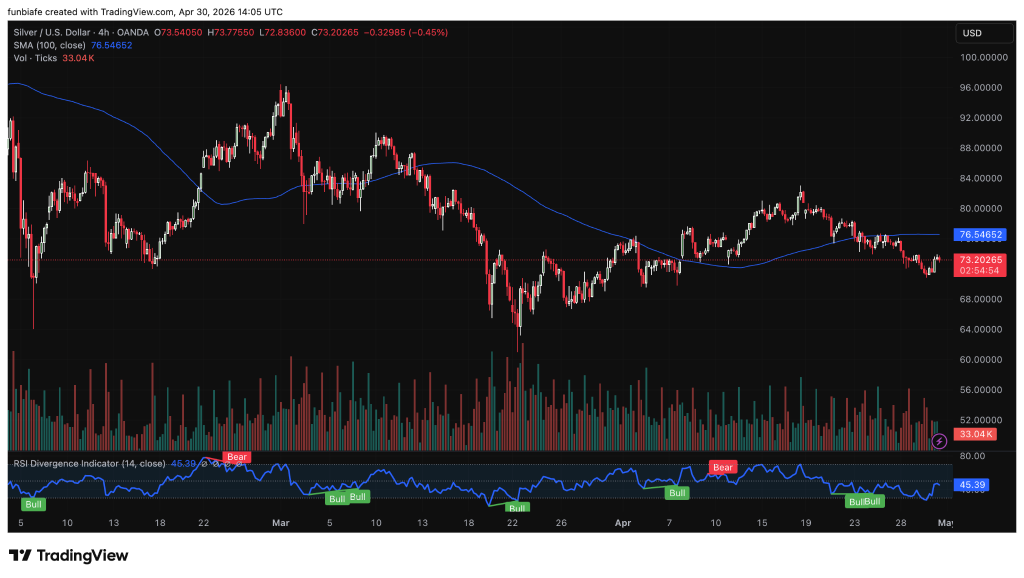
There was a recovery attempt after that, with the silver price pushing back toward $80, but it couldn’t hold. Since then, price has drifted back down toward the $72–73 area. One level that keeps coming into play is the SMA-100 near $76.54. Every time the price gets close, it struggles to move through it. That keeps the broader structure under pressure for now.
Momentum indicators add another layer to the story. There were earlier signals that called the top and the drop correctly, and now there are two fresh bullish divergence signals around the current support zone. That kind of setup often points to a possible bounce in the short term.
Read Also: Bitcoin Price News: BTC Has Played This Current Playbook Twice – and They Ended Badly
Silver Price Outlook: What Could Happen Next
Right now, the silver price is stuck between two ideas. The broader trend still looks weak because price hasn’t pushed back above key resistance levels. At the same time, the repeated support reactions and divergence signals hint that sellers may be losing strength.
If buyers step in here, the first move to watch would be back toward the $76–80 range. That’s where things start to change if price can break through and hold. If support gives way, then the next area to keep in mind is around $61, where the last major drop found a bottom.
For now, the silver price is in a waiting phase. The chart shows hesitation, but the bigger story is happening beneath the surface. If physical demand starts to matter more in a market dominated by paper contracts, the next move could come faster than expected.
FAQs
Subscribe to our YouTube channel for daily crypto updates, market insights, and expert analysis.