


Shiba Inu has spent most of 2026 moving in the wrong direction, and the latest technical outlook suggests the pressure may not be over yet. A fresh analysis from TheCryptoBasic points to a chart pattern that closely resembles one from 2023. If history repeats itself, the SHIB price could face another notable decline before a stronger recovery has a chance to develop.
A market update from TheCryptoBasic argues that the current SHIB price structure looks remarkably similar to the setup that developed during the second quarter of 2023.
Shiba Inu lost the important $0.00000628 support level in May 2026. Since that breakdown, SHIB has continued to produce lower highs and lower lows. That pattern usually shows sellers still control the broader trend.
The current SHIB price trades around $0.00000415 after spending several weeks inside a narrow consolidation range. TheCryptoBasic notes that this resembles the period between April and June 2023, when Shiba Inu moved sideways before another decline eventually pushed the token to a local bottom.
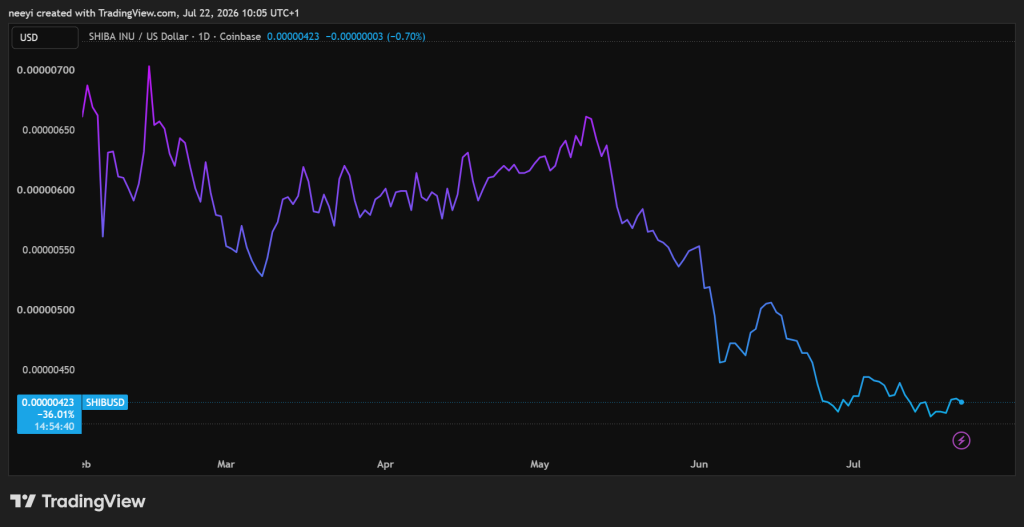
Based on that historical comparison, the analysis suggests SHIB could fall toward the $0.0000032 to $0.0000033 support area during late July and August. From the current SHIB price near $0.00000415, that would represent a decline of roughly 20%.
Historical patterns never guarantee future results, although they often provide useful reference points when market structures begin to resemble previous cycles.
What you'll learn 👉
Shiba Inu Has Faced Several Challenges Throughout 2026
The broader trend also explains why SHIB has struggled to regain strength this year.
Shiba Inu entered 2026 with a much stronger valuation. The SHIB price traded close to $0.00001845 before gradually losing momentum. Recent trading has remained between $0.0000041 and $0.0000043, leaving the token far below its earlier levels.
Several factors have contributed to that weakness.
Broader crypto market corrections reduced appetite for higher risk assets. Macroeconomic uncertainty, including concerns around global tariffs, also weighed on sentiment. Competition from newer meme coins created another challenge as investors spread capital across a wider group of projects.
#ShibaInu is showing renewed signs of weakness as its current price action closely resembles a bearish setup that unfolded in 2023.$SHIB has remained in a prolonged downturn since losing the critical $0.00000628 support level in May 2026. Following that rejection, SHIB has…
— TheCryptoBasic (@thecryptobasic) July 21, 2026
Those developments have pushed Shiba Inu down the cryptocurrency rankings, with SHIB now sitting around 33rd by market capitalization.
Current expectations for the remainder of 2026 remain measured. Stable consolidation or modest gains appear more likely than a rapid return toward previous highs.
On Chain Data Shows Some Positive Signs Beneath the Surface
Despite the weak SHIB price trend, several on chain indicators continue to paint a more balanced picture.
Exchange balances have declined since the middle of July as more SHIB moved into private wallets. Lower exchange balances often reduce immediate selling pressure because fewer tokens remain available for quick sales.
Large holders have also continued accumulating during periods of weakness. One notable transaction involved a withdrawal of approximately 162 billion SHIB from Coinbase Prime. That movement points to continued interest from larger investors despite the broader downtrend.
Token burns have continued as well. One July session removed around 110 million SHIB from circulation.
Even so, those burn figures remain relatively small compared with the circulating supply of roughly 589 trillion SHIB. Many analysts believe burn activity would need to increase substantially before it has a meaningful impact on long term supply dynamics. Future upgrades through the planned Shib Alpha Layer could eventually automate more burns if those features launch as expected.
Daily SHIB Indicators Continue to Favor the Sellers
Daily technical indicators from Investing.com continue to lean bearish, although a few readings show downside momentum has started to stabilize.
The Relative Strength Index (RSI) currently reads 42.918 with a Sell signal. That level remains below the neutral 50 mark and indicates buyers have not regained control of the trend.
The Stochastic Oscillator stands at 43.168, which also produces a Sell signal. Momentum remains weak even though the indicator is no longer deep inside oversold territory.
Read Also: This Elite Trader Updates His Kaspa Price Prediction
The MACD currently shows a Neutral reading. That suggests bearish momentum has slowed, although the indicator has not confirmed a bullish reversal.
The Ultimate Oscillator sits at 47.438 with another Sell signal. This reading points to continued weakness across multiple timeframes.
The Bull Bear Power indicator remains Neutral. Buyers and sellers appear relatively balanced in the short term, although neither side has established a decisive advantage.
| Indicator | Value | Signal | What the Reading Means |
|---|---|---|---|
| RSI (14) | 42.918 | Sell | Momentum remains below neutral and buyers have not regained control. |
| Stochastic (9,6) | 43.168 | Sell | Short term momentum remains weak despite recent consolidation. |
| MACD (12,26) | 0 | Neutral | Bearish pressure has eased, although no bullish crossover has appeared. |
| Ultimate Oscillator | 47.438 | Sell | Multiple timeframes continue to point toward underlying weakness. |
| Bull Bear Power (13) | 0 | Neutral | Buyers and sellers remain evenly matched for now. |
The latest SHIB price outlook presents a mixed picture. TheCryptoBasic’s historical comparison points to the possibility of another decline toward $0.0000032 if the current bearish structure continues. Daily indicators from Investing.com also lean toward the sellers, although momentum no longer appears as weak as it did earlier in the year.
Another factor deserves attention. Exchange outflows, whale accumulation, and continued token burns offer some constructive signs beneath the surface, even though they have not changed the broader trend yet.
FAQs
Subscribe to our YouTube channel for daily crypto updates, market insights, and expert analysis.






