Shiba Inu pumped 10% yesterday alongside Dogecoin after Elon Musk’s X Money announcement. SHIB now trades around $0.0000057 with a market cap near $3.3 billion. But the move comes after a rough stretch for meme coins.
Overall, SHIB has had a disappointing year of price action. Meme coins haven’t really been the story in crypto throughout 2025 and 2026 thus far. While other sectors grabbed attention, SHIB mostly traded sideways to lower.
But one analyst sees a familiar pattern forming that could change everything.
Javon Marks, a crypto analyst on X, shared a chart showing Shiba Inu nearing the breaking point of another falling wedge-like structure. He points out that the last move out of a similar pattern for SHIB consisted of an over 455% surge in prices.
According to his analysis, SHIB may be setting up here to do it all over again.
Shiba Inu Chart Analysis
We had a look at Javon’s Shiba Inu chart, and we can see SHIB’s price action over an extended period. The table shows consistent monthly values of 0.5% from 2021 through early 2028, though this appears to represent some type of indicator or metric rather than raw price data.
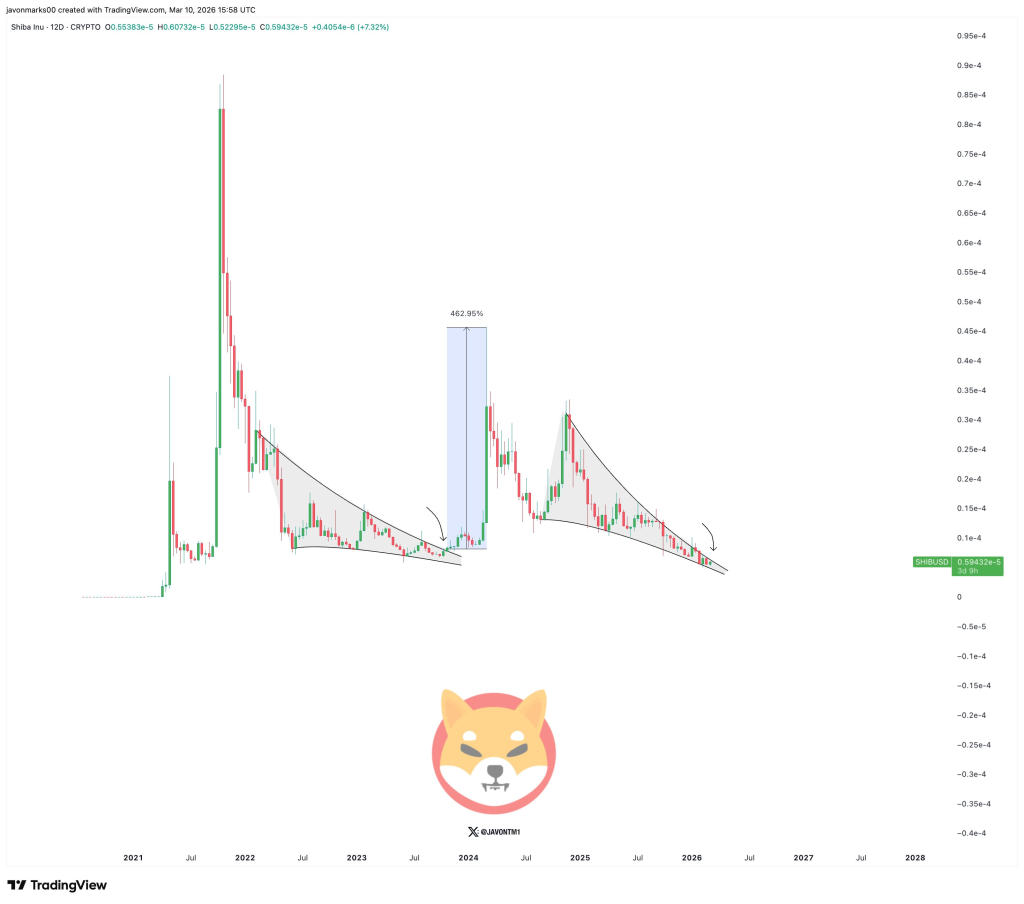
The falling wedge pattern Marks identifies forms when price moves between two descending and converging trendlines. It’s considered a bullish reversal signal, especially after a long downtrend. SHIB has been compressing within this structure, and the two lines are now nearing their confluence point.
The last time this setup played out, SHIB delivered a massive 455% rally. Marks believes history could repeat.
The falling wedge on SHIB’s chart shows sellers losing strength over time. Each downward move finds support at higher levels relative to the descending trendline, while resistance also drops. This compression typically leads to an explosive breakout when price finally clears the upper trendline.
The previous wedge breakout that led to 455% gains happened under similar conditions. SHIB had been consolidating, building pressure, until buyers finally stepped in and pushed price through resistance.
SHIB Price Targets If History Repeats
If SHIB breaks out from the current wedge and replicates that 455% move, the numbers get interesting. From current levels around $0.0000057, a 455% surge would take SHIB to approximately $0.0000317.
That target aligns with previous resistance zones on longer-term charts. It would also put SHIB back toward levels not seen since earlier in 2025 before the long downtrend began.
For the pattern to play out, SHIB needs to clear the upper boundary of the falling wedge with volume. The breakout should come on stronger buying pressure than seen during the consolidation phase. Volume confirmation matters.
If SHIB breaks down instead of up, the pattern fails. But right now, with price near the wedge’s apex, a decision point could be near.
Read also: Massive 126B SHIB Move Shocks Market as Shiba Inu Whales Accumulate
Subscribe to our YouTube channel for daily crypto updates, market insights, and expert analysis.