XLM is facing a worrying downtrend for investors, with the price declining over 20% in the last 30 days. The coin is currently trading around $0.10 at the time of writing.
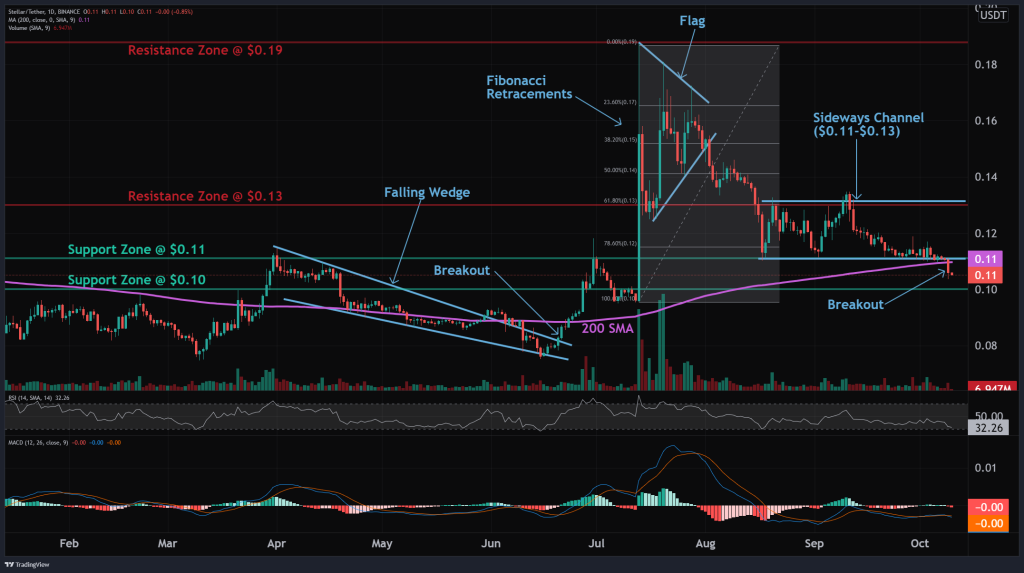
This sharp drop can be attributed to XLM breaking down from its Sideways Channel between $0.11 and $0.13. The break below the key support level of $0.11, which also corresponds to the 200-day moving average, has confirmed the downtrend.
Technical analysis shows that XLM had been trading in a neutral Sideways Channel, indicating market indecision. However, the bearish breakout points to sellers gaining control. Trend traders were waiting for a breakout in either direction before entering trades, while swing traders could trade the range.

Source: altFINS – Start using it today
The downtrend is evident on both the short- and medium-term timeframes, while the long-term outlook remains neutral currently, according to altFINS. Key momentum indicators like the MACD and RSI are also painting a bearish picture, with the MACD line crossing below the signal line and the RSI dropping below 45.
With the $0.11 support broken, XLM is at risk of dropping to the next key level of $0.10. The nearest resistance zone is at $0.13, followed by $0.19.
Overall, the technical outlook remains firmly bearish as long as XLM trades below the broken support and key moving averages. Conservative traders may want to wait for signs of a trend reversal before entering new long positions. Until then, the path of least resistance seems to be to the downside.
We recommend eToro
Wide range of assets: cryptocurrencies alongside other investment products such as stocks and ETFs.
Copy trading: allows users to copy the trades of leading traders, for free.
User-friendly: eToro’s web-based platform and mobile app are user-friendly and easy to navigate.


