The XRP price is getting a boost again, and this time, it’s because of the growing excitement around the first U.S. spot XRP ETF.
The market reacted quickly after Nasdaq issued the official listing notice for Canary’s XRPC fund, signaling that the SEC is preparing to make it effective today. If that happens, we could finally see an XRP ETF on U.S. soil for the first time.
Naturally, traders jumped back into the chart. The XRP price bounced sharply from last week’s dip, climbing toward the mid-$2 range and showing its strongest momentum in weeks. But even with this new wave of optimism, the chart shows one level that decides everything.
🚨 JUST IN: Nasdaq issues official listing notice for Canary’s $XRPC as the SEC prepares to make it effective today — positioning it to become the first U.S. spot $XRP ETF set to begin trading. pic.twitter.com/z0sclXm8xd
— RippleXity (@RippleXity) November 13, 2025
What you'll learn 👉
What the XRP Chart Is Showing
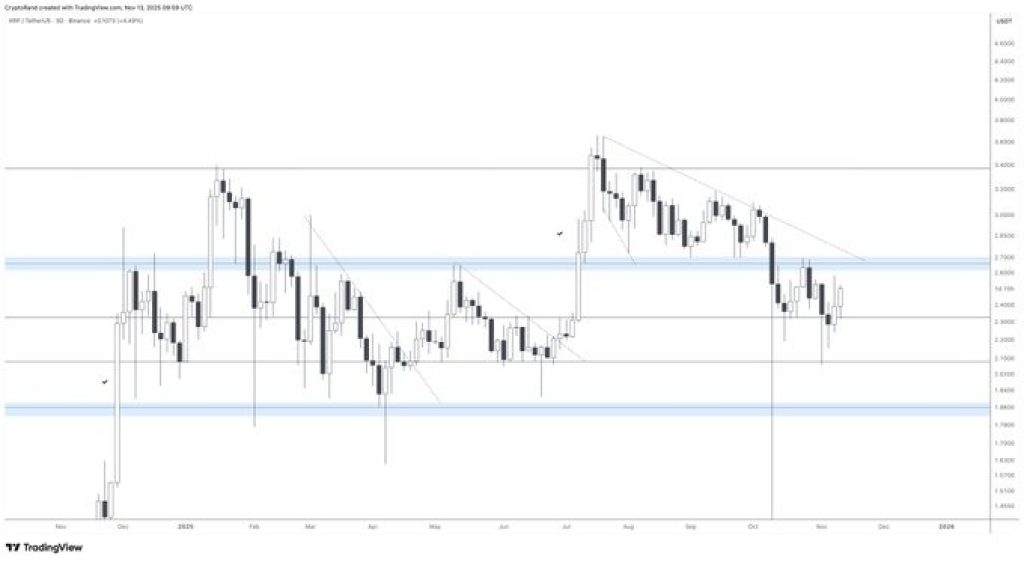
Analyst Rand highlighted the critical zone very clearly: $2.70. This price acts as a confluence of resistance, meaning multiple technical barriers line up in the same area.
The XRP price has struggled to break this zone multiple times throughout the year, and right now, it’s once again the key that determines whether the trend turns fully bullish.
The bounce itself looks healthy. XRP recovered quickly after a brief drop below $2.30, and the latest candles show buyers aggressively stepping in. But until the price closes above $2.70, this is still viewed as a range – not a breakout – by the market.
If the XRP price breaks and holds this level, the entire structure shifts. It would technically complete a full bullish reversal and open the door to much higher targets heading into late 2025.
What Happens If XRP Price Breaks $2.70
A clean breakout above $2.70 will flip the trend in favor of the bulls. Traders would then be looking for a move towards the next major zones, which are near $3.10 and $3.40, with stronger momentum likely returning as ETF demand increases.
A spot ETF is a huge catalyst because it brings traditional financial access into the picture. Bitcoin and Ethereum both saw strong flows after getting ETF approval, and many analysts expect something similar for XRP due to its large institutional following.
If ETF trading goes live this week and the XRP price breaks $2.70 shortly after, the market could see a sharp leg higher.
Moreover, the opposite scenario is much simpler. If XRP fails to break the $2.70 wall, the price may drift back toward the $2.30–$2.40 region where buyers stepped in earlier.
This doesn’t break the larger structure, but it would delay the bullish reversal and keep XRP stuck in the same sideways range it’s been in for months.
Momentum right now is improving, just not confirmed. ETF excitement is helping, but the chart still needs that final bullish trigger.
Read Also: Why Kaspa (KAS) Might Outrun Zcash (ZEC) in 2026
Ripple’s XRP Short-Term Outlook
XRP is in one of its most important phases in months. The ETF listing news has given the market a real spark, but the chart says everything comes down to how the XRP price reacts at $2.70.
Break that level, and the trend flips fully bullish. Fail again, and the price stays range-bound.
This is a classic “one level decides the next move” setup, and with ETF developments unfolding in real time, the timing couldn’t be more intense.
Subscribe to our YouTube channel for daily crypto updates, market insights, and expert analysis.