Ripple (XRP) price looks like it’s getting ready to make a strong move, and the chart shows some key clues. XRP has been stuck in a range for months, but that may be about to change. Based on the technical setup posted by analyst @MoonBittz, both bulls and bears are on edge, waiting to see which way the next big move will go.
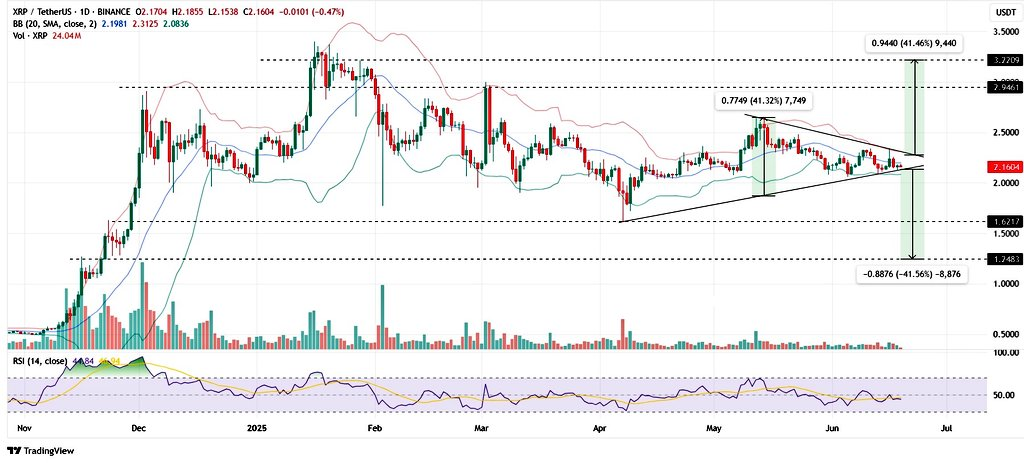
MoonBittz noted that since late 2024, the XRP price has been trading in a narrowing triangle. You can see this on the chart, where the highs are gradually getting lower and the lows are creeping higher. This creates what is known as a symmetrical triangle, a common pattern that usually leads to a breakout. The longer the price coils within this pattern, the more explosive the breakout tends to be.
At the moment, XRP is trading around $2.15, sitting right on the edge of this triangle pattern. This shows that the asset is reaching a decision point. The Bollinger Bands, which measure volatility, have tightened significantly. That means XRP price action has calmed down, but historically, this kind of squeeze leads to a strong move soon after.
What you'll learn 👉
The Potential Upside and Downside
Looking at the chart, the possible breakout could go in either direction. If XRP price breaks above the upper side of the triangle, the next move could push it up by around $0.94. That would take XRP close to the $3.72 zone, a level that has not been touched since the late 2017 bull run. The price projection is based on the measured move from the height of the triangle pattern.
But if the XRP price breaks down instead, things could get rough. The target to the downside is around $1.27 or even as low as $0.87. This would mean a fall of over 40% which would shake out a lot of late buyers. Either way, the triangle suggests that a big shift in Ripple price is just around the corner.
Momentum Indicators Add to the Suspense
The Relative Strength Index (RSI) is currently sitting around the mid 50 level. That means there is no clear momentum yet, but it is not in the overbought zone either. This neutral position matches the price action, showing that the market is waiting for confirmation. Volume has also dried up in recent days, which often happens before a major breakout.
Analyst @MoonBittz pointed this out clearly on X. He noted that XRP price has been stuck for seven months, leverage is down, and the Bollinger Bands are tightening. He hinted that a breakout is likely coming soon and said he is leaning bullish.
Read Also: Injective (INJ) Price Gears Up for Bullish Wave as Key Resistances Give Way
Final Thoughts on the XRP Price Outlook
Ripple has spent months building this pattern, and now it is nearly out of room. That means the XRP price is close to a breakout, and whichever direction it takes could set the tone for the rest of the year. If bulls win, XRP could climb fast toward the $3 mark. If bears take control, the drop could be just as sharp.
For now, all eyes are on the triangle. Whether you are bullish or bearish, the XRP chart is telling you clearly that the quiet phase may soon be over.
Subscribe to our YouTube channel for daily crypto updates, market insights, and expert analysis.