The $XRP coin has been under the spotlight. After a period of consolidation, many believe that the coin is poised for a significant move. The anticipation is palpable, with some members of the community suggesting that a massive event is on the horizon.
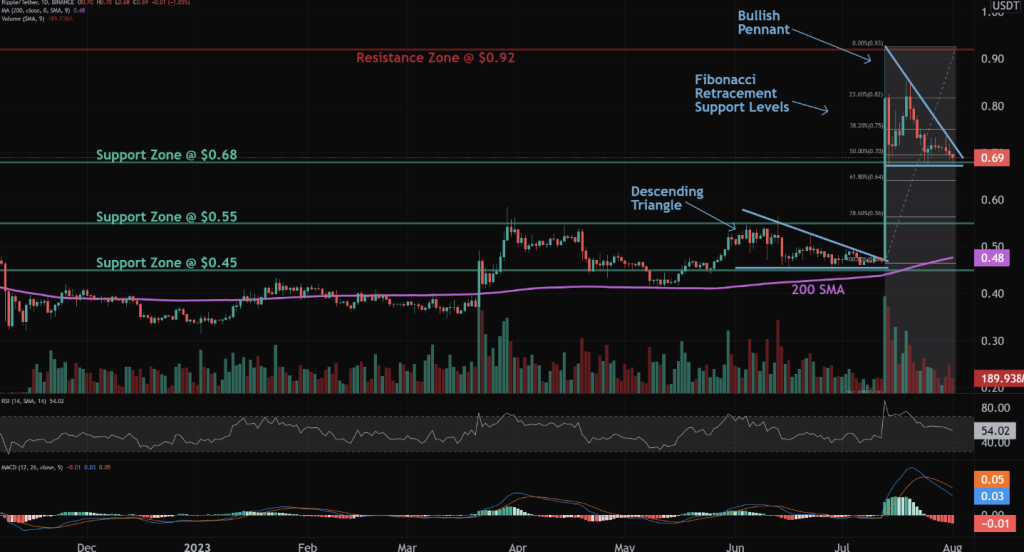
In today’s cryptocurrency market analysis, we turn our attention to the XRP price, courtesy of insights from the altFINS platform. The current trade setup reveals a clear uptrend for XRP, a trend that has been solidified by a breakout from a Descending Triangle. This breakout led to a significant price surge, propelling XRP to the $0.92 resistance level, a high not seen since early 2022. This surge was largely driven by a favorable legal ruling.
However, it’s crucial to note that the market became overbought, with the Relative Strength Index (RSI) exceeding 80. This led to some selling pressures as traders took profits, causing the price to consolidate into a Bullish Pennant pattern. altFINS’ technical indicators show that the profit-taking phase is now over.
This pattern is typically indicative of a potential bullish breakout, suggesting a resumption of the uptrend. Market watchers are keenly awaiting this breakout, which could see the price revisit the $0.92 mark and this is the next big target for XRP. In the event of a pullback, the Fibonacci Retracement support levels to watch are $0.70 (50%) and $0.56 (78%). Traders are advised to set a price alert for these levels.

Source: altFINS
The Bullish Pennant pattern is a significant one to watch. It typically forms following a sharp advance and is characterized by a brief triangular-shaped consolidation in price. This slight change in direction is usually followed by a resumption of the previous uptrend. It’s important to note that the period of consolidation should have a lower volume, and the breakouts should occur on a higher volume.
In terms of trend analysis, XRP is in an uptrend across all time horizons, be it short, medium, or long-term. However, the momentum is somewhat mixed. The Moving Average Convergence Divergence (MACD) line is currently below the MACD Signal Line, which is a bearish signal. On the other hand, the RSI is hovering around 50, indicating a neutral market.
In terms of support and resistance levels, the nearest Support Zone for XRP is at $0.68, followed by $0.55. On the flip side, the nearest Resistance Zone is at $0.92. These are the critical levels that traders should keep an eye on in the coming days.
Doge2014 raises 500K in days celebrating Dogecoin. Make potentially big profits and get in on exclusive airdrop!
Show more +A recent example of this volatility is the price action of $XRP. After winning a lawsuit against the Securities and Exchange Commission (SEC), the coin surged by almost 100%. However, it subsequently experienced a significant price pullback, something that might happen to the $KAS coin as well. This rapid change in price underscores the importance of being prepared for both bullish and bearish scenarios in the crypto market.
At the time of writing, XRP is trading at $0.664740, marking a 4% decrease in the last 24 hours. Over the past week, the token has seen a 7.3% decline and a more significant 18.3% drop in the last 14 days. Despite these short-term dips, the token has shown a 36% increase over the past 30 days and a substantial 77.6% rise over the past year.


