Ripple price has been trying to break free from a stubborn downtrend for weeks. As we can see from the daily chart, XRP managed to push above the descending channel that had been pressing it lower since early May.
This breakout gave many traders hope that Ripple price could start a fresh rally. But right after the breakout, XRP has been struggling to keep up the momentum. Even though there were a few bullish days, sellers quickly stepped in to push the price back down.
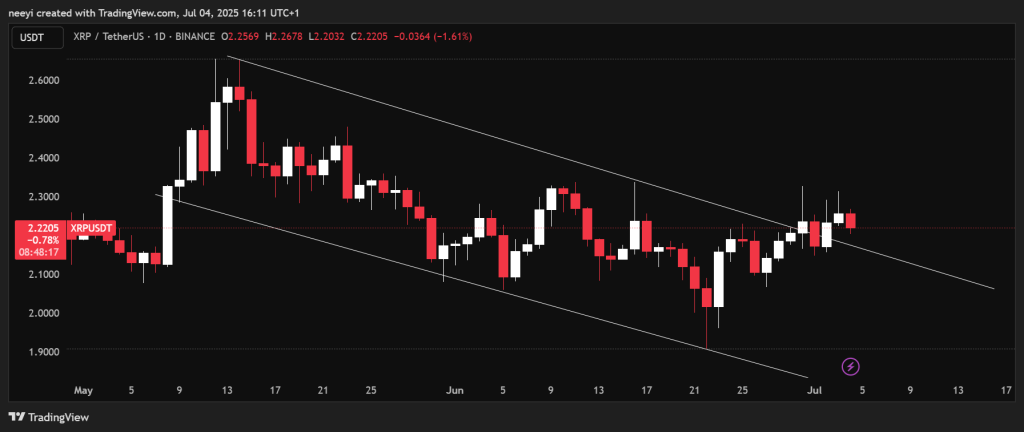
The XRP price now sits right around the former channel resistance line, and it is acting more like a ceiling than a floor. For Ripple to really confirm the breakout and attract new buyers, it needs to stay above this broken channel line and show some strong daily closes. If the price keeps slipping back inside the old channel, the market could see more selling pressure and even a return to the $2.00 area or below.
What happens next depends on whether the bulls can protect this zone. If they can keep Ripple price above $2.20 and avoid getting dragged back into the old pattern, there is a good chance that positive news or market sentiment could fuel another upward push. But if bears win this battle, XRP could fall back into a choppy sideways move or even resume the old downtrend.
Indicators Give Mixed Signals on XRP Price
Here is what the main daily indicators are telling us about Ripple price right now
| Name | Value | Action |
|---|---|---|
| RSI (14) | 52.374 | Momentum is balanced, no clear direction |
| Stochastic (9,6) | 67.464 | Showing some buying strength building up |
| MACD (12,26) | 0 | Momentum is fading, selling pressure rising |
| ADX (14) | 17.037 | Trend strength is weak, no dominant force |
| Williams %R | -24.869 | Market leaning towards buyers |
| Ultimate Oscillator | 48.749 | Market lacks conviction, leaning bearish |
Overall, the indicators are painting a confusing picture. The RSI sitting near 52 means the market is pretty balanced between buyers and sellers. The Stochastic and Williams %R are hinting that buyers are still trying to step in, but the MACD turning flat suggests the upward momentum could be losing steam.
Meanwhile, the ADX is quite low at 17, showing that the current trend is weak and not firmly in the hands of either bulls or bears. The Ultimate Oscillator sitting just below 50 also leans slightly bearish.
What’s Next for Ripple Price?
For now, XRP price is at a critical point. If it can hold above the broken channel and see a strong daily close above $2.20, it could set up a path for Ripple price to retest $2.40 and higher. That would attract more buyers and possibly kick off a stronger rally. But if the price slips back into the old descending channel, the bearish sentiment will likely take over again. In that case, XRP could drift back towards the $2.00 support area or even lower.
Read Also: 3 Reasons SEI Could Echo Solana’s Early Success This Bull Cycle
With indicators sending mixed signals, it is best for traders and investors to wait for confirmation before jumping in. A decisive move, either a strong breakout above $2.30 or a drop back under $2.15, will likely tell us which side is going to control the next big move in Ripple price.
Subscribe to our YouTube channel for daily crypto updates, market insights, and expert analysis.