The recent XRP price action is sending a clear warning. After climbing toward the $2.30 region, Ripple (XRP) failed to hold its gains and is now showing signs of weakness. The price is hovering just above the $2.00 mark, a critical psychological level, and momentum appears to be fading fast.
Looking at the 1-day chart posted by Ali charts, XRP has been trading inside a downward sloping channel for months. Every attempt to break higher has been met with rejection. The latest bounce stalled around $2.26, which aligns with a key Fibonacci level, and price has since pulled back sharply. This area is proving to be strong resistance, and traders are starting to show caution.
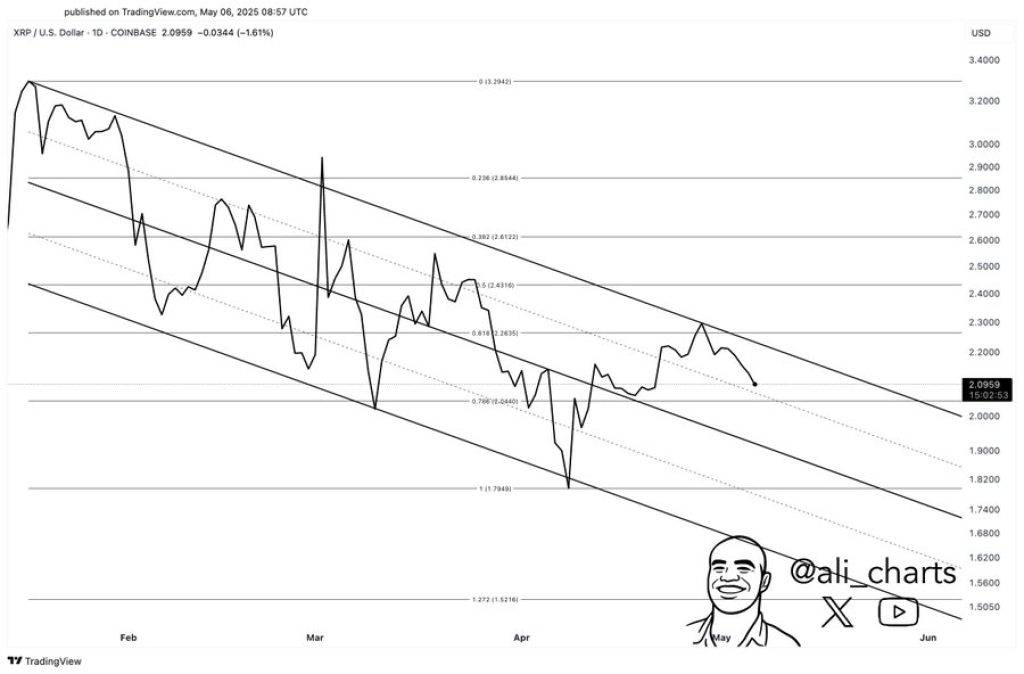
Ali, the well-known analyst from Ali Charts, pointed out that XRP is now stuck between $2.00 and $2.26. According to him, a decisive close outside of this range could be the catalyst for the next major move. Right now, it looks like XRP is leaning toward the downside.
What you'll learn 👉
Chart Patterns Confirm the Bearish Bias
On the 3-day chart, things look even more concerning. A bearish engulfing candle has just formed right below the $2.26 resistance zone. This type of pattern typically signals a trend reversal, especially when it appears after a short rally. That is exactly what’s happening now. The most recent candle didn’t just pull back, it completely engulfed the previous one, closing around $2.10 and wiping out all bullish momentum.
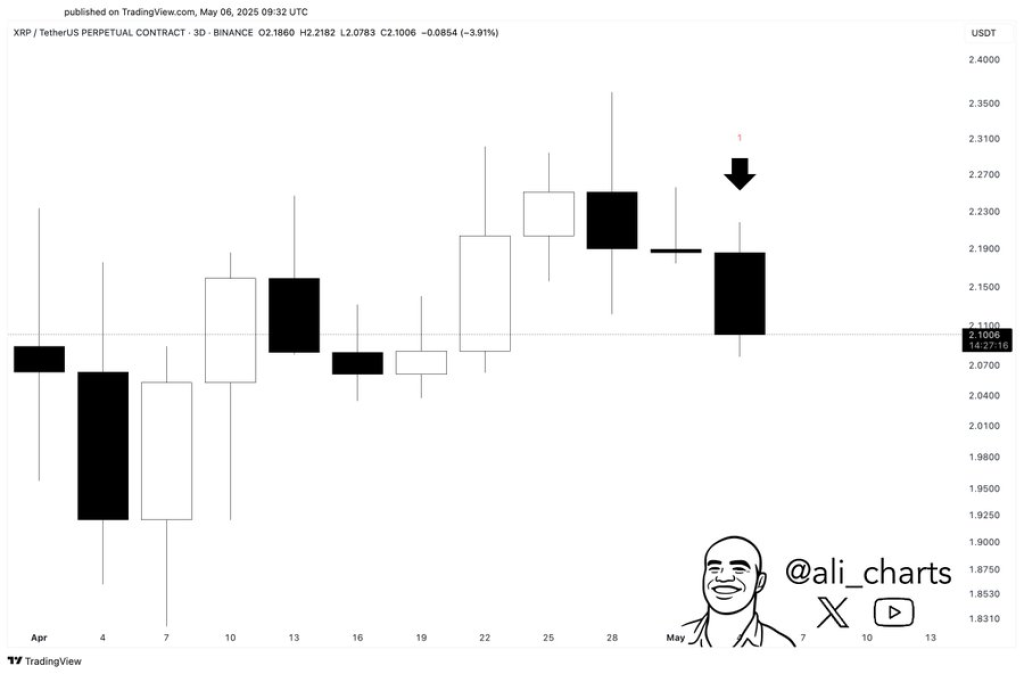
What makes this more alarming is that it happened right after a failed breakout attempt. The previous candle had a long upper wick, showing that buyers tried to push higher but were overpowered by selling pressure before the close. This kind of rejection is often followed by further downside.
Ali also pointed out that the TD Sequential indicator has flashed a sell signal on the 3-day timeframe. This adds another layer of bearish confirmation and supports the idea that XRP could be due for a deeper retracement.
How Low Can XRP Price Go?
If XRP loses the $2.00 support, it could be in trouble. This level has held multiple times before, but each test weakens its strength. A breakdown from here could drag Ripple price toward $1.95, where minor support might kick in. If that level fails as well, the next zones to watch are $1.80 and $1.61, both of which align with Fibonacci extension targets from the broader trend structure.
Read Also: The Harsh Truth About the Kaspa Price Action – Is the Market Ignoring the Crescendo?
At the same time, traders will want to keep an eye on the $2.26 resistance. If bulls manage to push price back above it and hold, the bearish outlook would need to be reconsidered. But unless that happens soon, the overall trend remains down, and sellers appear to be in control for now.
In short, XRP price is flashing several warning signs. Both the price structure and indicators highlighted by Ali from Ali Charts suggest a bearish phase may already be underway. Whether the $2.00 level holds or breaks could be the deciding factor in how low Ripple goes next.
Subscribe to our YouTube channel for daily crypto updates, market insights, and expert analysis.

We recommend eToro
Wide range of assets: cryptocurrencies alongside other investment products such as stocks and ETFs.
Copy trading: allows users to copy the trades of leading traders, for free.
User-friendly: eToro’s web-based platform and mobile app are user-friendly and easy to navigate.