Technical analysis is usually carried out by following patterns that an asset or trading instrument has exhibited over time. These have proven helpful over the years, with various experts relying on them to make their price predictions.
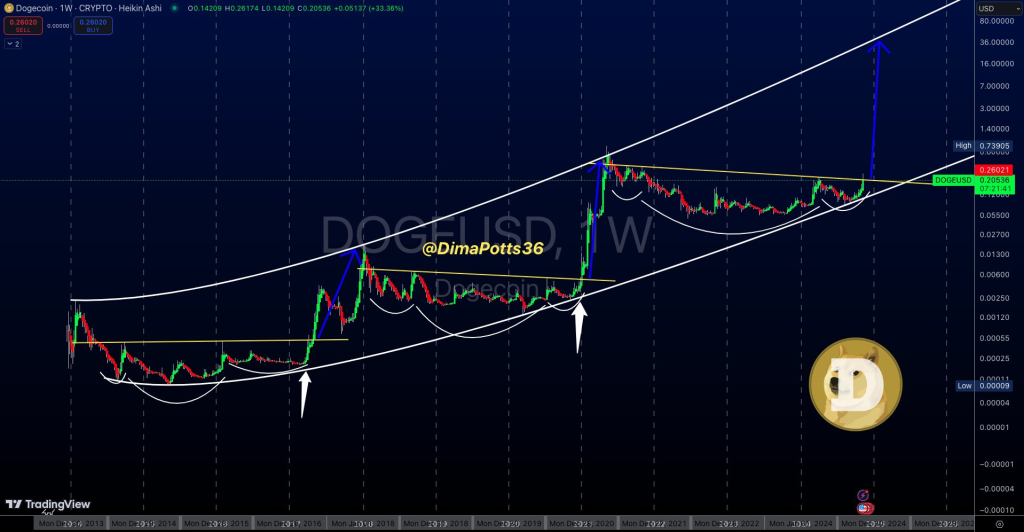
One of the patterns emerging bullish patterns is that of Dogecoin. It has been following a predictable price movement from a broader perspective over the years. Dima James Potts noticed this and brought it to the attention of his X followers a few hours ago.
Potts’ chart discusses the potential for Dogecoin to surpass the $10 mark in the current cycle. He notes his long-standing belief in the Inverse Head and Shoulders pattern, which he considers his preferred trading setup.
Read Also: Is Polkadot ‘Party’ Starting? Analyst Reveals His DOT Price Targets

Potts notes that in previous cycles, Dogecoin has consistently formed this pattern before experiencing substantial rallies. He recalls that in the first cycle, the price surged by over 3,364% after closing the week above a key resistance level marked by a yellow line.
The second cycle saw an even more impressive rise of approximately 12,189%. According to Potts, whenever Dogecoin has broken above this weekly resistance, it has triggered a parabolic breakout, suggesting that the cryptocurrency is poised for significant upward movement once again.
The meme coin is on the verge of breaking above this level again, as shown in the chart analysis. A successful breakout could see DOGE spike toward the top of the channel where it had spiked in the past. In this case, we could see a spike as high as $30.
Subscribe to our YouTube channel for daily crypto updates, market insights, and expert analysis.
We recommend eToro
Wide range of assets: cryptocurrencies alongside other investment products such as stocks and ETFs.
Copy trading: allows users to copy the trades of leading traders, for free.
User-friendly: eToro’s web-based platform and mobile app are user-friendly and easy to navigate.


