Polygon (MATIC) is at Crossroads of Potential Growth and Downturn Says Top Crypto Analyst, ADA Signals Potential Market Shifts
Polygon (MATIC) has been creating significant ripples. We believe it’s essential to monitor these progressions closely and comprehend their possible impacts.
Recently, MATIC has been following a pattern that suggests a significant shift could be on the horizon. The cryptocurrency experienced a Wave 1 impulse rally that peaked on August 22, followed by a Wave 2 downturn. Currently, it appears we are in the midst of a long C wave, the last wave of this correction. This analysis is based on insights from one of the top crypto analysts.
Doge2014 raises 500K in days celebrating Dogecoin. Make potentially big profits and get in on exclusive airdrop!
Show more +Interestingly, MATIC, along with several other altcoins, has not been following the market’s upward trend. However, this could change soon. There’s a possibility of a leading diagonal forming, which could signal further upside. But to confirm this, we need to see a first five-wave move up. This would be the first confirmation that a lasting low has been made.
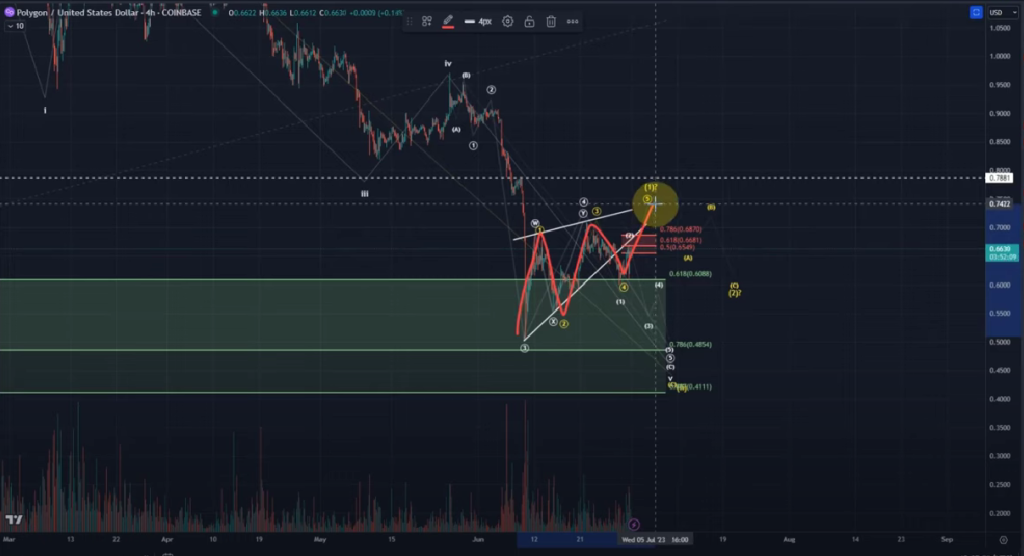
On the other hand, there’s a bearish wave count to consider. This suggests that the price came down on June 10th, likely a third wave, followed by a rally in three waves, likely a fourth wave in a WXY correction. If this pattern is complete, we could be looking at a third wave rally to the upside.
At this point, we are in a decision area. The price has a good chance to turn down, confirming the third wave down of the fifth wave. However, if the price breaks above 68.7 cents, it would give us a fifth wave. This would need to be confirmed by breaking above the 71 cent level.
In the case of Polygon (MATIC), the patterns suggest a potential for both an upward trend and a downturn. The key lies in the upcoming movements. If the price breaks above 68.7 cents, we could see a fifth wave, indicating a potential for further growth. However, if the price turns down, it could confirm a third wave down of the fifth wave, suggesting a bearish trend.
The cryptocurrency market is a complex and ever-changing landscape. But with careful analysis and a keen understanding of patterns, we can navigate this landscape and make informed predictions about what the future may hold. For now, all eyes are on Polygon (MATIC) as we wait to see which direction it will take.
Cardano (ADA) Navigates Rough Seas: An Ending Diagonal Pattern Signals Potential Market Shifts
Cardano (ADA) has been making waves, albeit in a somewhat tumultuous sea. It’s crucial to delve into the technical aspects of this digital asset to understand its current position and potential future trajectory.
Cardano’s price movements have been following a pattern known as an ‘ending diagonal’, a unique wave that typically signals the end of a cycle. Top crypto analyst explains that this pattern is part of the broader Elliott Wave Theory, a method used to analyze and predict market trends by identifying recurring wave patterns.
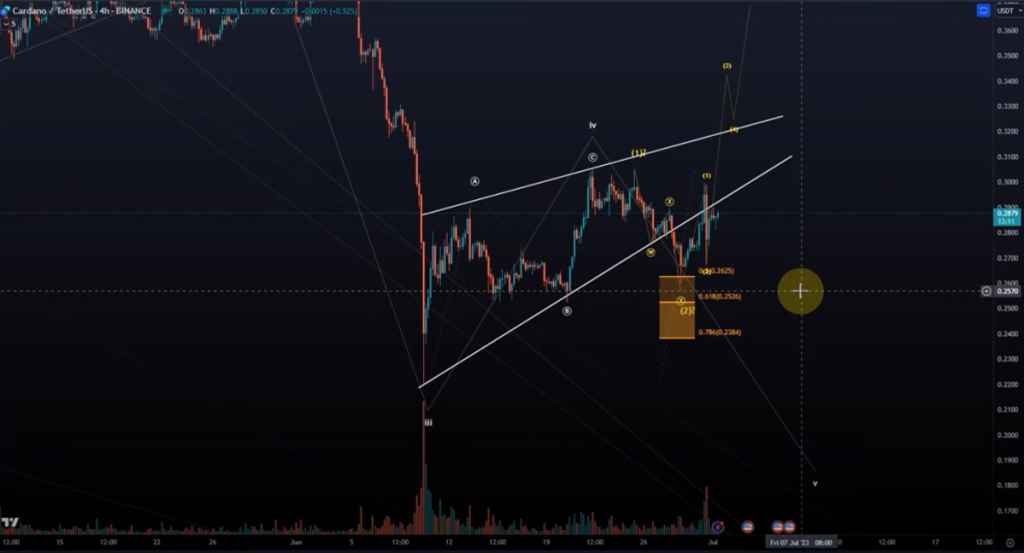
Currently, Cardano appears to be in the final stages of a correction phase, having completed the A and B waves of an ABC correction structure. The C wave is now unfolding, indicating that we might be witnessing the last steps of this correction.
However, the market is a realm of possibilities, and a bullish trend could be on the horizon for Cardano. For this to materialize, the price would need to break above the wave one high of 30.5 cents. A successful breakout could potentially see the price rally towards a minimum target of 33.2 cents in the third wave.
On the flip side, a more bearish scenario could see Cardano’s price continue its downward trajectory. This would involve a five-wave decline, with the third wave currently in progress. Despite a brief breakout above the resistance level, the price failed to sustain this upward movement, casting a shadow on the bullish scenario.
In the realm of cryptocurrencies, the only constant is change. While there’s potential for a bullish trend, the primary expectation leans towards a continued fall in price. Until there’s clear confirmation of a trend reversal, the prudent approach is to prepare for lower prices.
Cardano’s journey is a testament to the dynamic nature of the cryptocurrency market. As we navigate these digital waters, it’s essential to remain open to all possibilities and adjust our sails as the winds of the market change. This analysis, courtesy of More Crypto Online, serves as a compass guiding us through the complex world of cryptocurrency trading.