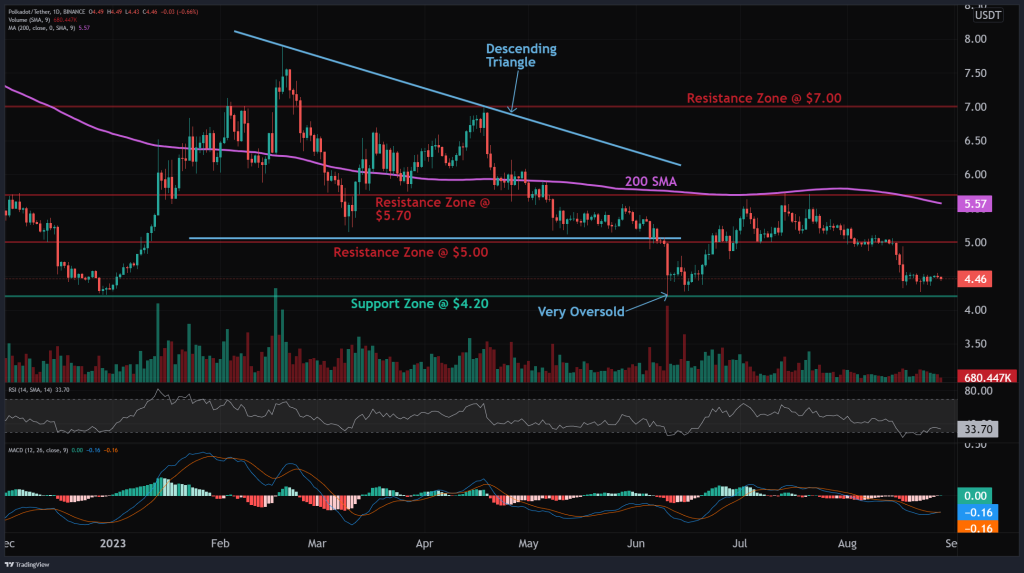
Polkadot ($DOT), a prominent player in the blockchain space, has been experiencing a rollercoaster ride in the market. The cryptocurrency has recently broken through a significant volume resistance, signaling a potential upward trend. However, the overall sentiment remains cautious as the asset has re-entered its previous trading range, sparking discussions about its future trajectory.
What you'll learn 👉
Technical Analysis
Resistance and Support Levels
The asset has been struggling to maintain its momentum, facing multiple rejections at key resistance levels. Specifically, the price has been unable to surpass the 200-day moving average, which stands at approximately $5.77. After these rejections, the price retreated to a support level of $4.20. This particular support level has historical significance, as it has held up in various instances, including late last year.

Source: altFINS – Start using it today
The nearest support zone for Polkadot is at $4.20, while resistance zones loom at $5.00, $5.70, and $7.00. These levels are crucial for traders and investors to watch, as they could indicate the asset’s future direction.
Market Indicators
RSI and MACD
The Relative Strength Index (RSI) has dipped below 30, indicating that the asset is currently in oversold territory. This could suggest a near-term bounce. However, the overall trend for Polkadot remains bearish across short, medium, and long-term horizons.
Doge2014 raises 500K in days celebrating Dogecoin. Make potentially big profits and get in on exclusive airdrop!
Show more +The Moving Average Convergence Divergence (MACD) line is currently below the MACD Signal Line, reinforcing the bearish sentiment. However, some analysts note that the MACD Histogram bars are rising, hinting that momentum may be bottoming out and could be nearing another upswing.
The community remains divided on Polkadot’s future. While some are optimistic about the recent break in volume resistance, others are more cautious, expecting further consolidation. The mixed sentiment adds another layer of complexity to the asset’s already volatile nature.
Polkadot finds itself at a critical juncture. While it has shown signs of life with a break in volume resistance, the overall trend remains downward. Key support and resistance levels, along with market indicators like RSI and MACD, will be crucial in determining its next move. As always, traders and investors are advised to exercise caution and set appropriate price alerts to navigate this uncertain landscape.
The price of Polkadot ($DOT) has seen a surge in the last 24 hours, currently trading at $4.58. The asset has experienced a 2.95% increase within this period, capturing the attention of traders and investors alike. The 24-hour trading volume stands at approximately $118,986,921.
We recommend eToro
Wide range of assets: cryptocurrencies alongside other investment products such as stocks and ETFs.
Copy trading: allows users to copy the trades of leading traders, for free.
User-friendly: eToro’s web-based platform and mobile app are user-friendly and easy to navigate.


