
Pi Coin remains under pressure this week, with the price trending sideways after failing to reclaim the $0.66 resistance zone.
After last month’s failed breakout attempt near $1.75, the token has lost momentum and is now trading at $0.6340, down -1.28% over the past day.
With volume dropping and technical indicators leaning bearish, traders are watching closely to see if the next move will break below support, or if another bounce is coming.
Let’s break down today’s outlook.
What you'll learn 👉
📅 What We Got Right Yesterday
Yesterday’s prediction showed three potential scenarios were outlined. The most probable one, a neutral zone between $0.636 and $0.66, played out as expected.
Price stayed trapped in that narrow band, showing weak volatility and little directional intent. The bearish scenario warned that a failure to hold $0.636 could drag the price back toward $0.630 or even $0.61.
Although $0.636 was briefly tested, it held for now. As anticipated, there were no bullish catalysts to trigger upside momentum, keeping the price locked in range.
📊 Pi Coin Daily Overview (June 12)
- Current Price: $0.6340
- 24h Change: -1.28%
- 4H RSI: 41.20
- Volume: Fading, lower than early May volatility burst
Pi coin price action continues to flatten, with small candles and short wicks. A key support band sits at $0.60 – $0.62, and sellers are slowly tightening control. The major resistance level remains at $0.66, with the broader resistance band extending up to $0.70.
🔍 What the Pi Coin Chart Is Showing
The daily chart is still showing a clear downtrend, defined by a descending trendline from March to May. The most recent price top, just below $1.00 in May was sharply rejected, confirming that bears are defending every rally.
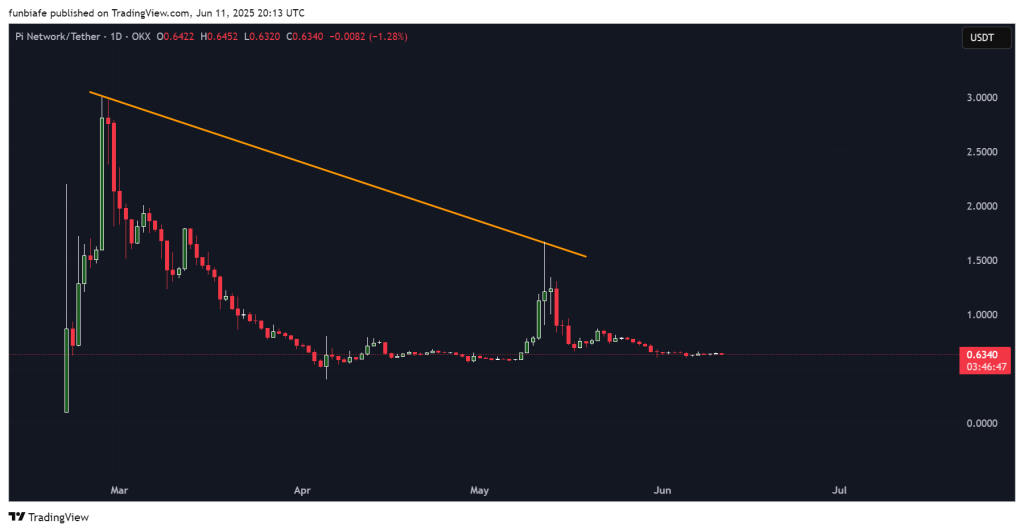
Since mid-May, the price has moved in a compressed range, signaling a lack of momentum and possible accumulation. If the price breaks below $0.62, the next zone to watch is $0.50.
📈 Technical Indicators (Daily Timeframe)
| Indicator | Value | Signal / Interpretation |
| RSI (14) | 41.206 | Weak momentum, below neutral zone |
| ADX (14) | 38.398 | Strong trend strength (downtrend) |
| MACD (12,26) | -0.024 | Bearish crossover, declining momentum |
| CCI (14) | -57.087 | Slight bearish pressure |
| Ultimate Oscillator | 46.009 | Weak buying pressure |
| ROC | -0.0349 | Price momentum declining |
| Bull/Bear Power (13) | -0.0349 | Sellers still dominate |
Summary: All major indicators show a bearish setup. Momentum is fading, and no sign of reversal is in place yet.
🔮 Pi Coin Price Prediction Scenarios
Bearish Scenario:
If $0.636 fails to hold, price may slide toward $0.61 or even $0.60. Continued weakness in volume and momentum supports this view.
Neutral Scenario:
Pi Coin price may continue moving sideways between $0.636 and $0.66, with no clear direction until a catalyst emerges. This is the most likely path for today.
Bullish Scenario:
If Pi Coin breaks above $0.66 on volume, a move toward $0.70 could follow. But without strong news or a listing, this scenario remains unlikely for now.
🧠 Wrapping Up
Pi Coin price continues to trade in a narrow band with fading volume and low volatility. Indicators remain bearish, and the descending trendline above still limits any upward movement. As long as the token trades below $0.66, upside appears limited.
The current setup favors a sideways grind unless buyers return with strength. Watch for a daily close below $0.630 or above $0.66 to confirm the next move.
Read Also: Polygon’s POL Price Pumps, Analyst Eyes $0.50 in the ‘Coming Weeks’
Subscribe to our YouTube channel for daily crypto updates, market insights, and expert analysis.

We recommend eToro
Wide range of assets: cryptocurrencies alongside other investment products such as stocks and ETFs.
Copy trading: allows users to copy the trades of leading traders, for free.
User-friendly: eToro’s web-based platform and mobile app are user-friendly and easy to navigate.