PENDLE Price Analysis: Key Indicators Reveal Bullish Trajectory, But Can the Token Maintain Momentum?
PENDLE token price movements and bullish momentum have seen notable interest from traders and investors. Key technical indicators suggest potential upward trends. Analyzing candlestick patterns, Fibonacci retracement levels, and trading volume reveals insights into the tokens market behavior. Price recovery lately and increased volume highlight important opportunities and levels to monitor.
What you'll learn 👉
Pendle Price Analysis
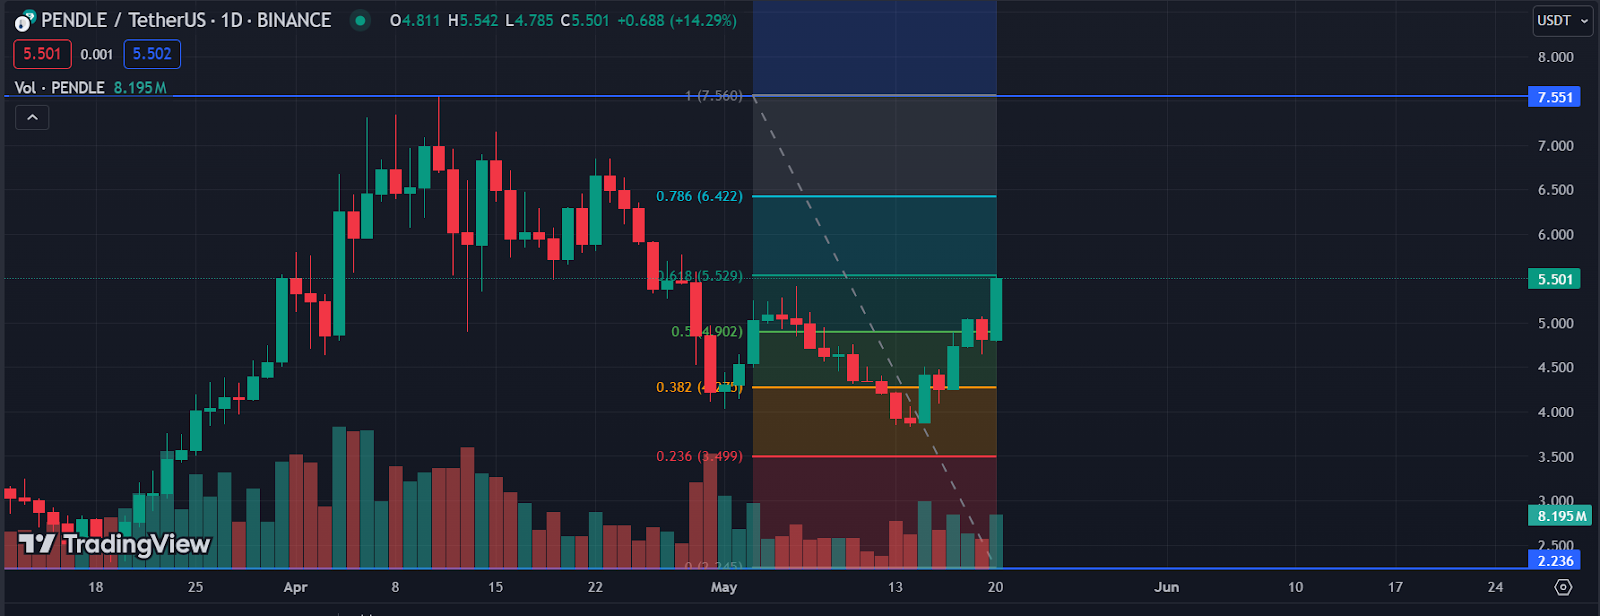
The daily price chart of PENDLE displays both red and green candlesticks. Green candles indicate days when the closing price was higher than the opening price, suggesting bullish momentum. Conversely, red candles show days when the closing price was lower than the opening price, indicating bearish movement. This mix of candlesticks reflects ongoing market activity and investor sentiment.
The recent price movement of PENDLE is key. After dipping to around $3.9, the token has rebounded to around $5.501. This rise suggests a strong recovery and hints at bullish momentum. The price currently hovers near the 0.618 Fibonacci retracement level at $5.529, a critical point to watch for potential resistance or support.
Technical Indicators: Fibonacci Retracement Levels and RSI
Fibonacci retracement levels are crucial in analyzing PENDLE’s price movements. Key levels are drawn from a high of approximately $7.560 to a low of around $3.245, with significant levels at 0.236 ($4.099), 0.382 ($4.629), 0.5 ($4.902), 0.618 ($5.529), and 0.786 ($6.422). These levels often act as support or resistance, influencing price actions.
The price of PENDLE has tested the 0.618 level, suggesting a bullish trend if it can sustain above this point. Furthermore, the Relative Strength Index (RSI) currently stands at 59.00. This value indicates slight overbought conditions but remains below the typical threshold of 70, suggesting potential for further upward movement.
Volume Analysis and MACD Indicator
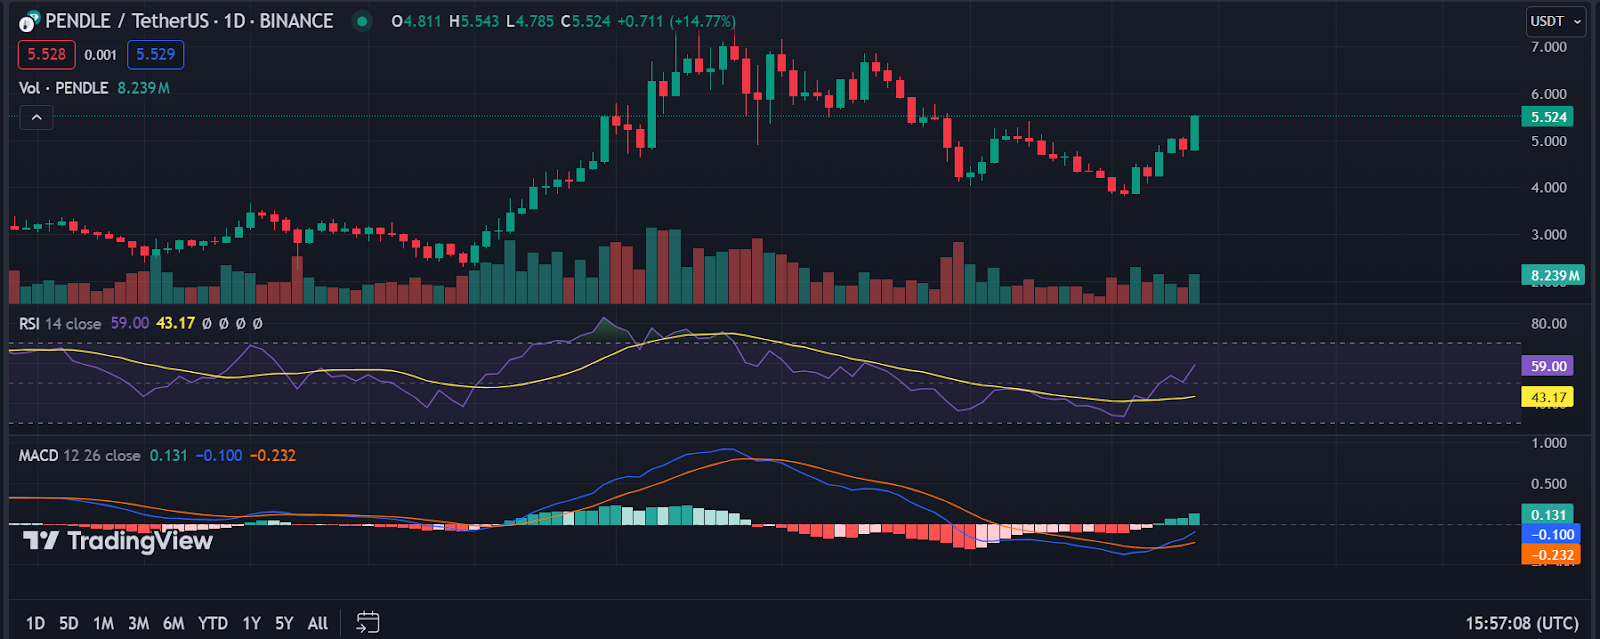
Trading volume provides additional insight into market trends. Recent price surges in PENDLE have been accompanied by increasing volume, indicating strong buying interest. High volume during upward price movements often confirms bullish trends and investor confidence.
The Moving Average Convergence Divergence (MACD) indicator further supports this analysis. The MACD line at 0.131 is above the signal line at -0.100, a bullish crossover suggesting strengthening short-term momentum. The histogram at -0.232 indicates this positive shift, reinforcing the potential for continued price increases.
Doge2014 raises 500K in days celebrating Dogecoin. Make potentially big profits and get in on exclusive airdrop!
Show more +Market Implications and Future Trends
PENDLE’s immediate resistance is at the 0.618 Fibonacci level ($5.529). If the price holds above this level, it may target the 0.786 level at $6.422. Conversely, if the price falls, the 0.5 level at $4.902 might provide support. The presence of increasing volume and a rising MACD suggests a bullish outlook in the short term.
However, potential risks should be considered. An RSI moving into overbought territory (above 70) or a negative MACD crossover could indicate a reversal. Additionally, a sudden increase in red volume bars might signal a sell-off.
PENDLE token exhibits a bullish trend, supported by various technical indicators. Traders should watch for key Fibonacci levels and volume changes to confirm the trend’s strength
Hunting for a small cap coin that could explode 10x? We’ve unveiled a few last week alone.
Get all our future calls by joining our FREE Telegram community.

We recommend eToro
Wide range of assets: cryptocurrencies alongside other investment products such as stocks and ETFs.
Copy trading: allows users to copy the trades of leading traders, for free.
User-friendly: eToro’s web-based platform and mobile app are user-friendly and easy to navigate.