Analyzing Cardano’s Support and Resistance Zones From On-Chain Data
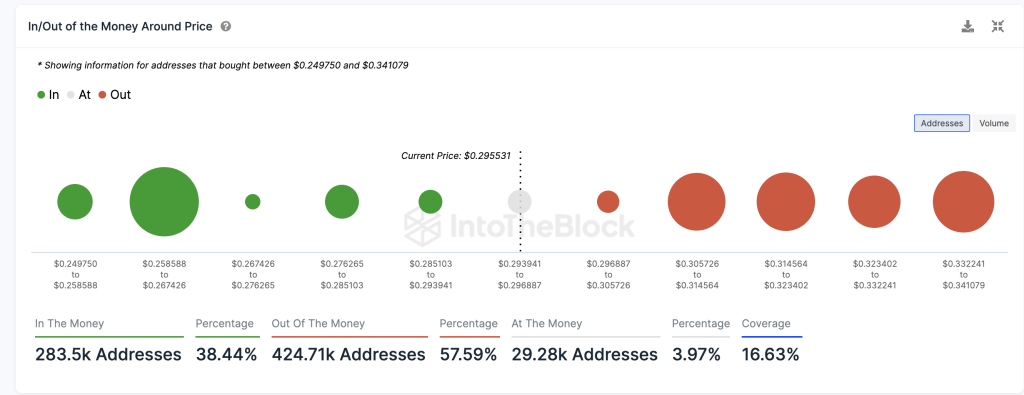
According to recent data from on-chain analytics platform IntoTheBlock, some key support and resistance levels for Cardano’s ADA token have emerged based on clustered groups of addresses that are in profit or loss at the current price.
The Global In/Out of the Money metric classifies all Cardano addresses into three groups – those addresses in profit (in the money), at their breakeven price (at the money), or at a loss (out of the money). By aggregating addresses into price clusters, IntoTheBlock can identify significant on-chain support and resistance levels.
The data shows ADA currently faces resistance around the $0.315 level, where a large cluster of addresses previously bought and would break even if selling at that price today. This means we can expect selling pressure and difficulty crossing above $0.315 until that cluster of addresses is “flipped” into profit.

On the flip side, the $0.26-$0.28 levels will likely act as near-term support, as a large group of addresses hold ADA purchased around that price range. These holders would be incentivized to accumulate more on dips to that support zone rather than sell at a loss.
Notably, over 57% of all Cardano addresses are currently out of the money, which could add selling pressure if ADA drops further from current levels. Monitoring tools like IntoTheBlock’s in/out of the money clusters are useful for anticipating how on-chain behavior could impact price action at key levels. Traders should watch the $0.306 and $0.315 zones closely as potential areas of interest.
Technical analysis by altFins
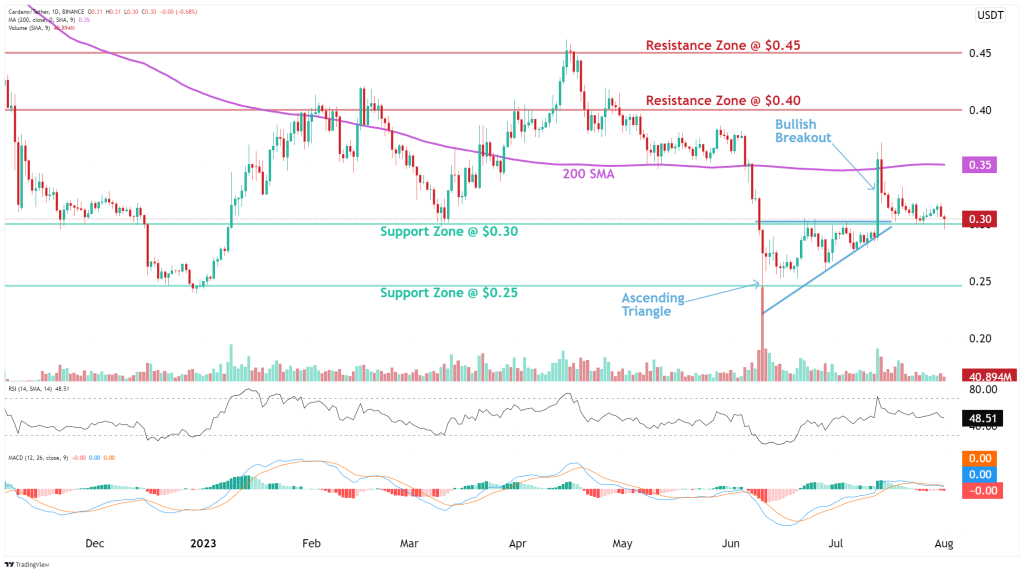
Cardano saw a bullish breakout from an Ascending Triangle pattern that hit our target of $0.35. However, it failed to break above the key 200-day moving average resistance, which it needs to confirm a trend reversal to uptrend. Price has now pulled back to support around $0.30. A break below $0.30 could see Cardano resume its prior downtrend and retest the $0.25 level.
The medium-term trend remains neutral while the short- and long-term trends are in downtrends. Momentum is mixed with the MACD histogram negative but RSI at a neutral 50.
On the downside, Cardano has support at $0.30 followed by $0.25. Resistance is at $0.40 then the 200-day MA around $0.45. Traders should watch $0.30 support closely and be ready to exit longs or enter short positions if it breaks down. A move above $0.35 is needed to turn the outlook bullish.


