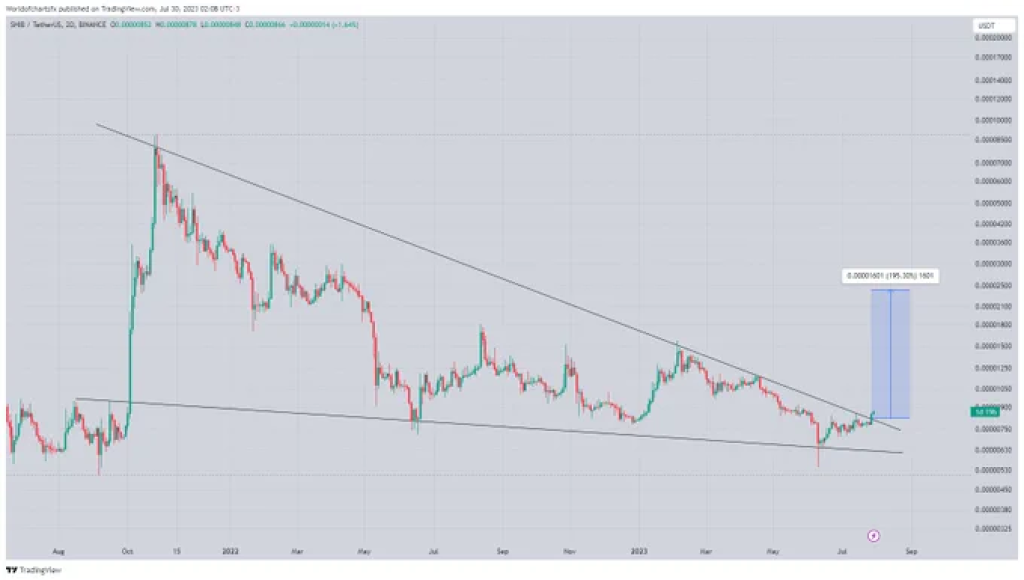
Twitter analyst, World of Charts, has recently shared some bullish predictions for $SHIB. In a recent tweet, the technical analysis expert noted that $SHIB was finally breaking a falling wedge pattern, with decent volume coming in. He expected a massive breakout and, in case of a successful breakout, he predicted a 150 – 180% bullish rally.

World of Charts, in another tweet confirmed that the falling wedge breakout had indeed occurred as expected, further solidifying the expectation of a massive bullish rally.
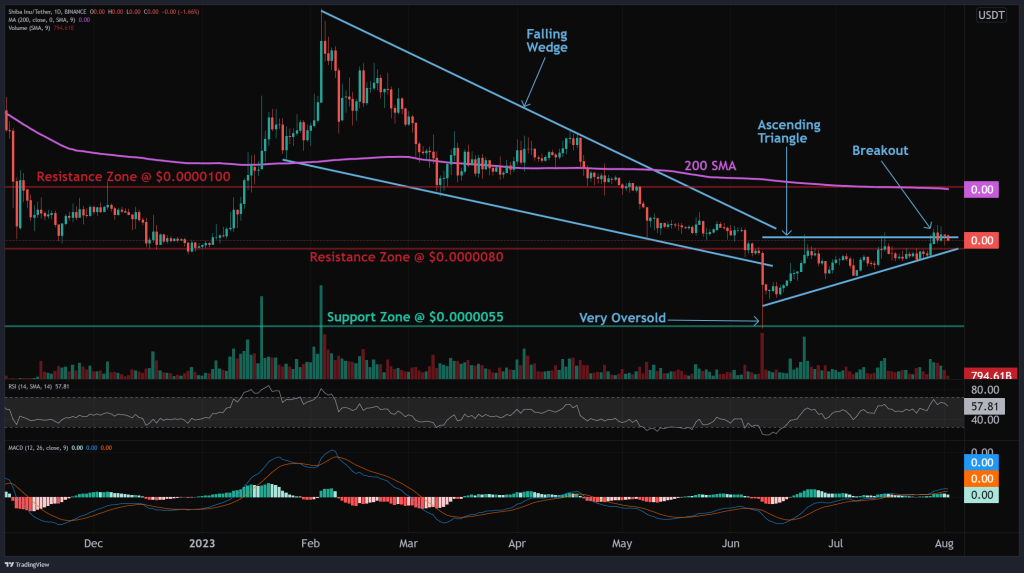
This bullish outlook is supported by data from Altfins, which identifies an Ascending Triangle pattern, a bullish breakout from which could signal a possible trend reversal. The upside potential is to $0.000010 resistance, which is also the 200-day Moving Average. The trend is upward on a short-term basis, neutral on a medium-term basis, and downward on a long-term basis.

The momentum is bullish, with the MACD Line above the MACD Signal Line and the RSI above 55. The nearest support zone is at $0.0000055, and the nearest resistance zone is at $0.0000080, which it has broken, then $0.0000100, and $0.00001200.
However, amidst this bullish outlook, there is a notable slump in the burn rate of $SHIB. According to data from Shibburn, the burn rate has decreased by 51.99% in the last 24 hours. As of the latest data, the Shiba Inu (SHIB) token is currently trading at $0.000008367, marking a 1.32% increase over the last 24 hours. The 24-hour trading volume for SHIB is about $147.15 million.
Doge2014 raises 500K in days celebrating Dogecoin. Make potentially big profits and get in on exclusive airdrop!
Show more +In conclusion, while the technical analysis and patterns suggest a bullish outlook for $SHIB, it’s crucial to keep an eye on the burn rate and other fundamental factors.


