
Bitcoin price is bouncing back, making investors wonder if a recovery is coming. New data shows something interesting happened: just as Bitcoin jumped from $74,500 to $81,200, there were 1,715 large transactions (over $1 million each) on the network.
These big transactions, called “whale movements,” often hint at what might happen next in the market. Analyst Ali shared this data from Santiment, suggesting that major investors might be preparing for a price rise.
1,715 whale transactions of over $1 million hit the network yesterday right as #Bitcoin $BTC surged from $74,500 to $81,200, as shown by on-chain data from @santimentfeed! pic.twitter.com/IEboSEhEKg
— Ali (@ali_charts) April 8, 2025
What you'll learn 👉
BTC Bitcoin Whale Activity Points to Possible Upswing
Looking at Bitcoin’s weekly chart shows some promising signs. According to Ali, a technical indicator called TD Sequential showed a “9” count on the last downward candle. This often means the downward trend is ending and prices might start climbing.
This signal lined up perfectly with Bitcoin’s price hitting bottom at $74,500 before moving up. The bounce happened right at an important support level (Fibonacci 1.0 at $74,457). The price is now approaching another key level at around $82,003.
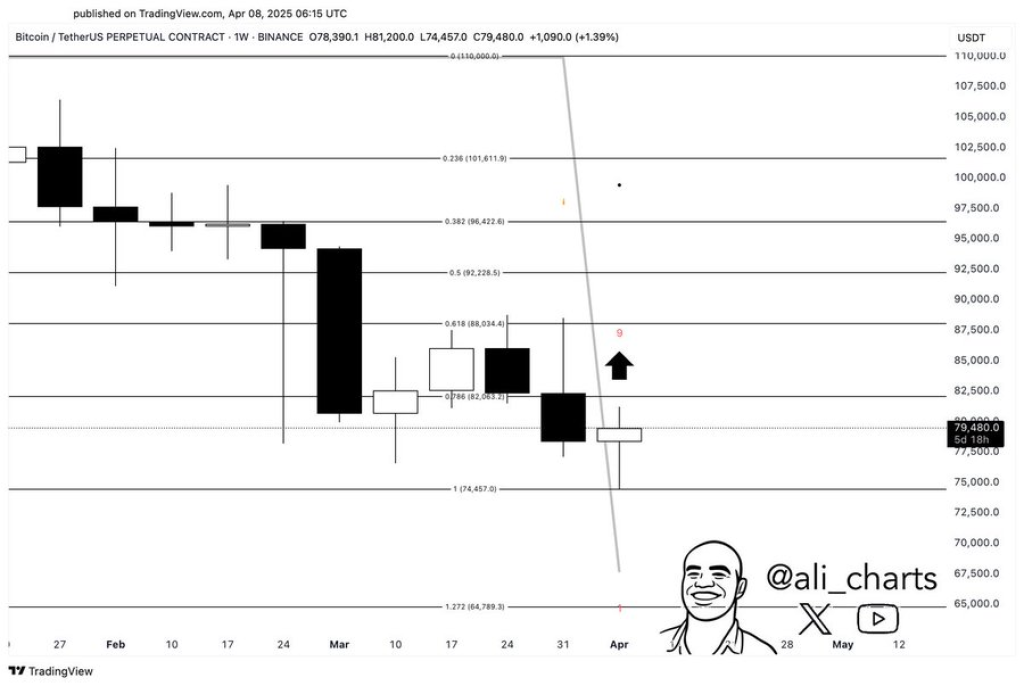
When these three things happen together – TD Sequential buy signal, price bouncing off support, and many whale transactions – it often means good things for Bitcoin’s price.
Is a Rebound Here? BTC Price Analysis
Since January, BTC has been trading below a downward trendline. The current price rise is heading toward this trendline again. In the past, sellers have always stepped in when price reached this line. If they do it again, we could see more selling pressure and possibly even lower prices.
Read Also: Ripple Just Bought a Prime Broker for $1.25B – and Is Bringing the XRP Ledger Along for the Ride
This downward trendline has created a pattern of lower highs throughout early 2025. Now, Bitcoin has bounced from around $76,000 and is moving toward this important level again.
The trendline will be crucial for any further price increases. Every time Bitcoin touched this line before, sellers jumped in and pushed prices down. If this happens again, the downward trend will likely continue.
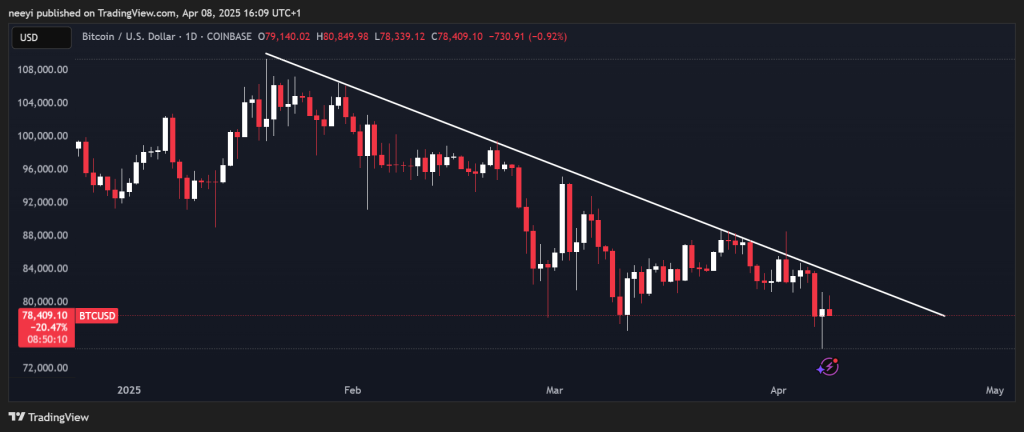
Bitcoin is now at a critical point. It has bounced up from support but now faces resistance at the downward trendline. If it breaks above this line, we might see a major trend change. If it gets rejected again, prices will likely keep falling.
The Fibonacci levels in Ali’s chart give us possible targets if Bitcoin keeps moving up. If it stays above $82,003, the next targets would be $88,034, then $90,000, and possibly $92,228.
But if sellers appear at the trendline again, Bitcoin could test lower support levels, possibly dropping below $74,500 and heading below $70,000.
Subscribe to our YouTube channel for daily crypto updates, market insights, and expert analysis.

We recommend eToro
Wide range of assets: cryptocurrencies alongside other investment products such as stocks and ETFs.
Copy trading: allows users to copy the trades of leading traders, for free.
User-friendly: eToro’s web-based platform and mobile app are user-friendly and easy to navigate.