Kaspa Open Interest Drops While Leverage Builds – What’s Next for KAS Price in This Long-Heavy Market?

The Kapsa (KAS) price is trading around $0.03340, and it’s been stuck in a tight range even as major developments continue to roll out.
On one side, Kaspa is preparing for the Toccata hardfork between June 5 and 20, which will introduce KRC-20 tokens and turn the network into a programmable Layer 1.
On the other, adoption is already there, with nearly 2 billion transactions processed and throughput hitting over 10,000 transactions per second.
Add in Gate’s integration of Kasplex for smart contracts, and the fundamentals are hard to ignore. Still, price hasn’t reacted in a big way, which raises the real question,what’s holding KAS back right now?
What you'll learn 👉
Long-Heavy Positioning Builds Under the Surface of KAS Price
Data shared by Kaspa Daily shows volatility has dropped to 58.8%, far below the 88.0% historical average and well under the 143.6% peak seen in October. That kind of compression often leads to expansion phases. The KAS price has traded near the $0.035 region since late January, with no clean breakout.
Kaspa 30D rolling volatility at 58.8%, well below the 88.0% historical average. Peak this cycle was 143.6% back in October.
— Kaspa Daily (@DailyKaspa) April 27, 2026
Compression phase. Price has been ranging around $0.035 since late January.
Vol this low usually doesn't last. pic.twitter.com/SMvswBU1x4
Also, leverage is building in one direction. Open interest is at $41.5 million, down 2.3% on the week, yet funding rates are elevated. Traders holding long positions are paying as much as +1.00% on some exchanges, with most platforms near +0.50%. That imbalance shows a long-heavy market.
$KAS sitting 1.3% above 30D MA, 2.1% above 90D MA. BTC correlation at 0.52.
— Kaspa Daily (@DailyKaspa) April 26, 2026
NVT ratio at 88.6, up 88.8% vs 90D average — valuation running well ahead of network activity despite 11.3M daily transactions (+12.3%).
Kaspa Puell Multiple at 0.53. Hashrate 407.6 PH/s, down 1.5% from… pic.twitter.com/ui7GWE7hvZ
Other metrics add context. The NVT ratio is at 88.6, up 88.8% compared to its 90-day average, even with 11.3 million daily transactions, which are up 12.3%. That gap points to valuation running ahead of activity.
$KAS funding rates skewing heavily positive across the board. HTX and Gate leading at +1.00%, most majors (Binance, Bybit, MEXC, Bitget, BingX, WhiteBIT) sitting at +0.50%.
— Kaspa Daily (@DailyKaspa) April 26, 2026
KuCoin and CoinEx the outliers at -0.77% and -0.88%. Kraken near flat.
Longs paying to stay in. pic.twitter.com/d48oJThUg3
Whale wallets holding over 10 million KAS reduced exposure by 0.58% on the week, bringing total holdings to 7.57 billion KAS. Exchange reserves stand at 4.89 billion KAS.
Liquidation data also leans one way. Over the past seven days, $89,000 in long positions were liquidated compared to just $3,000 in shorts. That confirms the imbalance, with longs dominating positioning.
Here’s What The Kaspa Chart Is Showing
We had a look at the chart, and price action continues to respect a wide consolidation structure. After a strong rally in mid-March that pushed the KAS price above $0.040, it retraced and settled back into the $0.031 to $0.036 range.
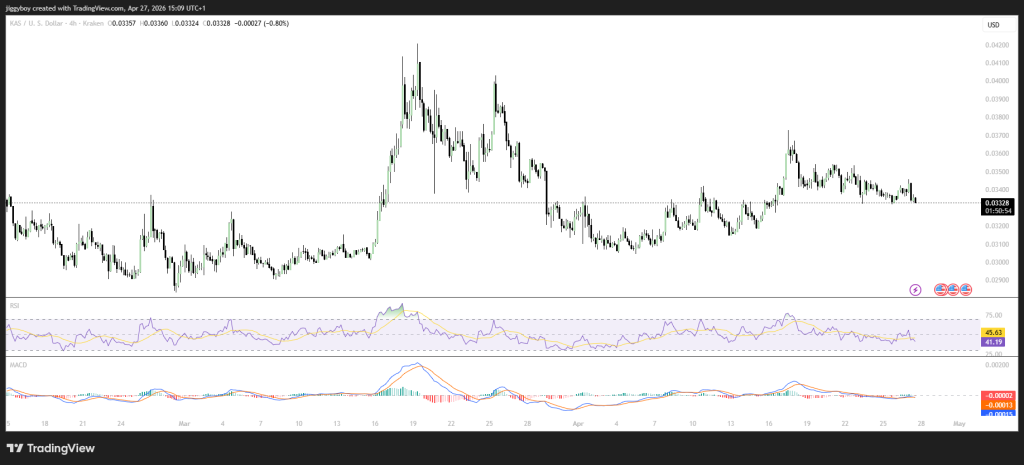
The current level near $0.033 places KAS close to the middle of that range. Resistance remains near $0.035–$0.036, where price has been rejected multiple times. Support is forming around $0.031, which has held during several tests since early April.
Momentum indicators align with this structure. RSI is near 45, showing mild weakness without extreme selling pressure. MACD is flat, with no strong directional push. This combination matches the low-volatility environment highlighted in the data.
Read Also: Here’s the Solana (SOL) Price If Western Union’s USDPT Stablecoin Goes Live on Mainnet Next Month
Kaspa Price Prediction for this Week
The setup creates three clear paths for KAS price this week.
In a bullish move, if price breaks above $0.036, that could set off a run to $0.038 and maybe back to the March highs near $0.040. For that to happen, traders would need to change their positions. Funding rates would have to cool down, and buyers would need to show up with real demand.
In a bearish case, the long-heavy structure becomes a risk. If the KAS price drops below $0.031, it could trigger long liquidations, pushing it toward the $0.029 region. The imbalance in funding increases the chance of that kind of flush.
The most likely path, looking at the data now, is more sideways action between $0.031 and $0.036. Low volatility, flat momentum, and mixed signals from the network all point that way. Once price does break out of this range, the move should be sharp. Conditions are that tight.
Kaspa is at a tipping point. The fundamentals are strong. Supply is almost fully circulated. Transaction counts keep going up. Upgrades are on the way. All of that supports the bigger story. But derivatives data tells a different story. The long trade is crowded, and funding rates are high.
That combination keeps the KAS price locked in a narrow range for now. The next move will likely come from a break in that balance, either through a demand-driven breakout or a liquidation-driven drop.
Frequently Asked Questions
Subscribe to our YouTube channel for daily crypto updates, market insights, and expert analysis.