Solana (SOL) has been dealing with steady selling pressure for several days, and the chart has reflected that weakness clearly. The SOL price slid into the mid-$130 range, where it’s been trying to settle after a pretty aggressive pullback.
Traders have been waiting for something to hint that the worst of the drop might be behind us, and now they finally have a reason to pay attention.
Analyst Ali pointed out that a key momentum indicator has flashed a buy signal on the 12-hour chart, which often shows up when a downtrend is running out of steam. It doesn’t confirm a full reversal, but the timing is interesting.
What the SOL Chart Is Showing
The chart Ali shared paints a very specific picture. After a series of large red candles, the recent price action has tightened up into smaller, more controlled candles. Moves like this at the end of a sell-off usually mean that sellers are starting to slow down.
The SOL price touched lows of around $138 and has since then tried to stabilize above that level, and the quieter candles suggest that the market is taking a breather. If this area holds, it would easily become the base for a short-term bounce.
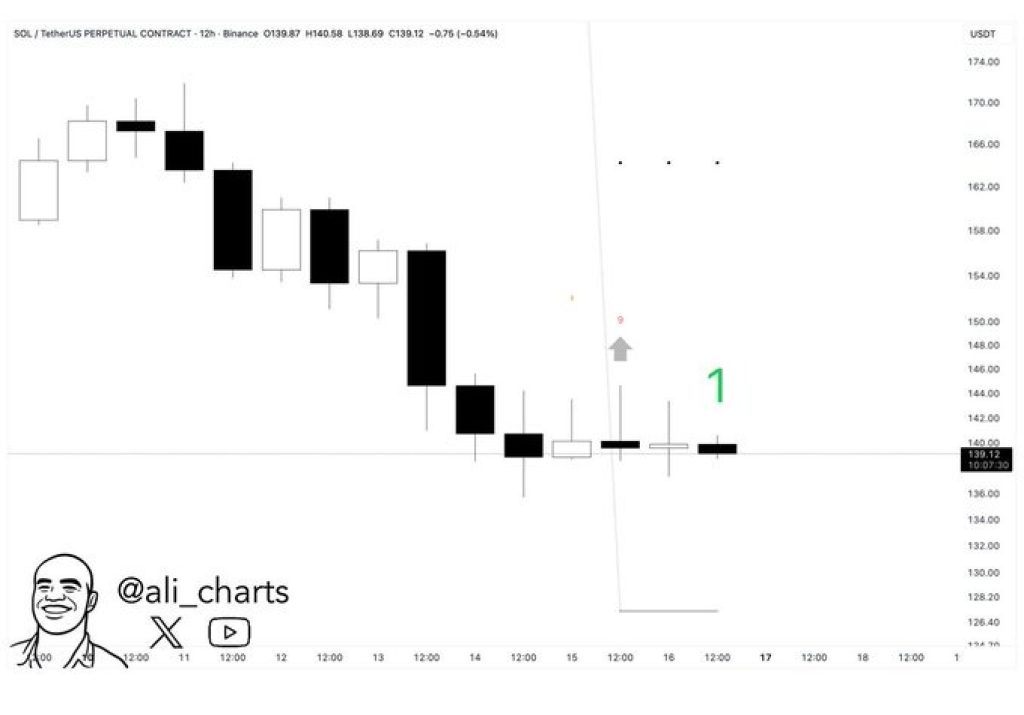
Moreover, momentum has been negative for a while, but the structure of the chart is changing. A series of small-bodied candles after a heavy drop is often the first hint that selling pressure is fading.
It doesn’t mean the buyers have stepped in with conviction yet, but it does mean the imbalance that pushed the SOL price down so quickly is starting to ease. Holding above the $138 to $142 region becomes crucial here, because that could be the point where sentiment starts to shift.
Read Also: Here’s Where Pi Coin Price Could Go Once the Pi DEX Finally Launches
Where Solana Price Could Go Next
If buyers finally show some strength, the first move would likely be a push toward the $145 to $148 area. Clearing that zone would show that the market is warming up again, and it could bring attention back to the chart.
The bigger test sits near $152, where several previous breakdowns began. Recovering that level would be a strong sign that the SOL price has a real chance to reverse the downtrend and climb higher toward the mid-$160s.
If, on the other hand, SOL loses its support around $138, the price could slide toward the next demand zone near $126 before any meaningful recovery appears.
If, instead, SOL loses its support around $138, then the price could slide to the next demand zone near $126 before any meaningful recovery appears. For the moment, the Solana price finally sees its first sign of encouragement after days of weakness.
If it slips back under support, the market probably has one more drop to absorb before a true reversal takes shape. Either way, this is one of the most important moments for price short-term trend.
Subscribe to our YouTube channel for daily crypto updates, market insights, and expert analysis.