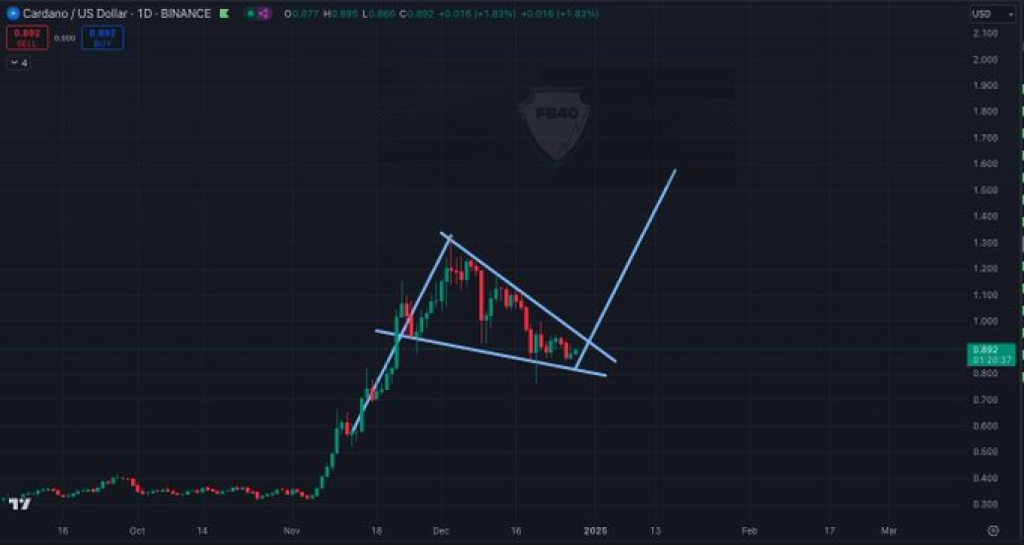
The price of ADA has been showing interesting patterns. The daily chart shows a symmetrical triangle forming—a pattern that often hints at where the price might go next. Prominent analyst Freedom By 40 posted about it on X (formerly Twitter), saying, “$ADA looks great for continuation,” showing some faith in the market’s direction.
What you'll learn 👉
ADA Chart Analysis
Cardano’s price chart reveals a substantial rally preceding its current consolidation phase. After climbing steadily for a while, the price has settled into a pattern where two trend lines are moving closer together, forming what traders call a symmetrical triangle. Based on past market behavior, this often means the price might keep moving in the same direction it was going before.
Traders have noted that the price is approaching the apex of the triangle, where breakouts typically occur. Historically, these formations, combined with reduced trading volume near the apex, often precede significant price movements.

Key Support and Resistance Levels
The symmetrical triangle structure defines clear support and resistance zones for ADA’s price. The lower trendline acts as a dynamic support level, consistently preventing further price drops. On the other hand, the upper trendline has served as resistance, with price movements failing to breach this level during the consolidation phase.
If ADA successfully breaks above the resistance, it could signal a continuation of its previous bullish rally. Conversely, a breach of the support line could open the door to further downside movement.
Moreover, Freedom By 40’s optimistic tweet reflects growing bullish sentiment surrounding ADA. While the chart itself does not explicitly display volume, analysts emphasize its importance in confirming potential breakouts. A breakout with high volume above the resistance line would validate bullish momentum. However, a breakdown below the support level, accompanied by increased volume, could signal bearish pressure.
Read Also: Hedera (HBAR) Price Could Reach $5 in 2025, Expert Predicts – Here’s Why
What’s Next for Cardano?
Traders are closely observing ADA’s next move as it nears the triangle’s apex. The triangle’s height at its widest point offers a potential target for post-breakout price levels. Right now, everyone’s waiting to see which way the price will break – up or down. That’ll give us a better idea of where ADA’s price is headed soon.
With crypto prices always moving up and down, lots of people will be watching what ADA does next.
Subscribe to our YouTube channel for daily crypto updates, market insights, and expert analysis.
We recommend eToro
Wide range of assets: cryptocurrencies alongside other investment products such as stocks and ETFs.
Copy trading: allows users to copy the trades of leading traders, for free.
User-friendly: eToro’s web-based platform and mobile app are user-friendly and easy to navigate.


