A steady slide often feels like background noise until it reaches a point where the chart starts telling a different story. ADA has spent the past few weeks drifting downward and now trades near $0.50. However, it looks like something is brewing in the background, and the price might be getting ready for some big moves.
A chart shared by Bit Amberly adds more interest to this moment since it places the Cardano token on a familiar zone where strong activity has formed in the past.
What you'll learn 👉
Cardano Price Pointing Toward a Possible Turning Point
The ADA price continues to move inside a wide descending channel that has guided its behavior for months. Each touch of the upper trendline stalled momentum, then sent price lower, while each interaction with the bottom range attracted buyers.
The current position sits directly at that lower boundary near $0.51. Bit Amberly notes that this region has acted as a base across multiple phases, which gives the structure a sense of rhythm.
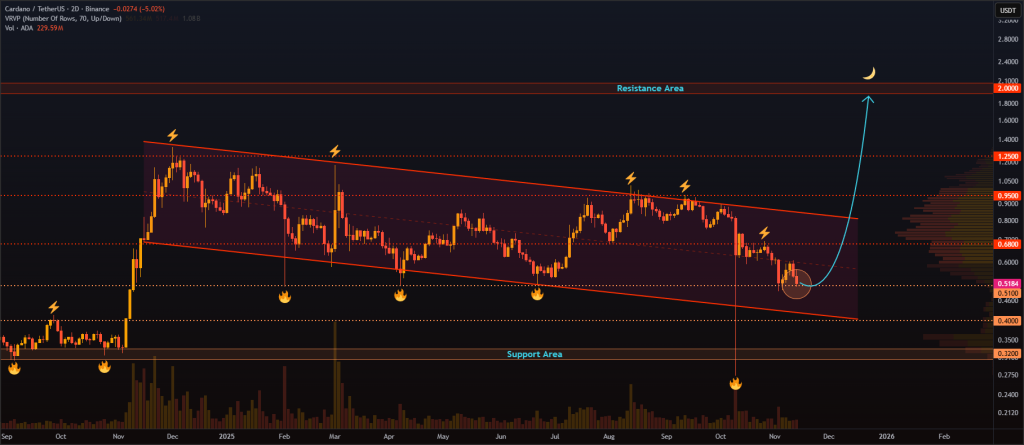
A return to this zone brings back the pattern seen earlier in the year where pressure faded and the Cardano token climbed back toward the middle of the channel.
A rebound from this area has historically stretched toward levels such as $0.68, then $0.95, then $1.25 before the upper line around $2.00. Those figures form mile markers rather than guarantees, although the structure suggests why traders keep drawing attention to this point.
The chart shared by Bit Amberly paints a picture of a market reaching a familiar bend in the road. The Cardano price has been compressing for weeks, which tightens the coil. The setup does not promise a shift, although it gives a clearer reason why the current zone matters.
Cardano Token Technical Indicators Showing Pressure
A closer review of daily indicators on Investing .com gives more context to the mood around ADA. Several signals point toward weakness while offering clues about how the trend has been behaving. The readings are shown below with explanations based on their position and movement.
| Name | Value | Action |
| RSI(14) | 33.155 | The market shows weakness since the reading leans closer to oversold conditions which often appear during fading momentum |
| STOCH(9,6) | 46.607 | The positioning sits in the middle range which shows neither strong buyers nor strong sellers taking control |
| MACD(12,26) | -0.041 | The negative spread signals a bearish environment that has not yet flipped into upward momentum |
| ADX(14) | 29.223 | The trend strength shows firmness which means the ongoing direction continues to hold weight |
| Ultimate Oscillator | 37.537 | Price action still shows softness which usually appears during prolonged downward phases |
The cluster of signals leans toward weakness, although not toward panic. RSI and the Ultimate Oscillator circle the lower end of their ranges, which usually appears during stretches where sellers lose force after extended pressure. MACD holds below its signal line, which confirms the softness on momentum.
ADX sits at a point that reflects a steady trend which means the downward push remains intact. Stoch sits in a neutral zone and signals hesitation rather than commitment from either side.
This blend fits the chart shared by Bit Amberly since the daily indicators show a market pushing toward the end of its downward strength.
Cardano token has reached a point where exhaustion from sellers becomes more visible. A shift from this zone often requires fresh demand although the technical picture shows why many eyes remain on the current structure.
Read Also: The Privacy Thesis Following $ZEC’s 10x Rise: Why Crypto Can’t Reach Mass Adoption Without It
ADA Holding an Interesting Setup as the Next Move Approaches
The ADA token has spent several months forming a slow squeeze inside its descending channel. Each cycle through the structure pulls attention back to the lower boundary, which is exactly where the Cardano price sits now. The chart posted by Bit Amberly highlights the rhythm that ADA has repeated throughout the year, which creates an interesting backdrop for the next movement.
A clear direction has not formed yet, although the compression suggests the next chapter could bring stronger movement. A steady climb from here would follow earlier patterns while a deeper dip would stretch the channel further. Either path keeps ADA in a zone worth watching since pressure and hesitation have been building for weeks.
Subscribe to our YouTube channel for daily crypto updates, market insights, and expert analysis.