
Cardano (ADA) is again in the spotlight as price volatility picks up. After a short-lived bounce on Tuesday, the crypto market slipped nearly 4% over the last 24 hours, and ADA price took an even bigger hit, dropping 7.30% and landing around $0.5616. Trading volume also dipped about 4%, adding more weight to the bearish tone. With momentum turning shaky, traders are discussing whether a bigger drop could be coming.
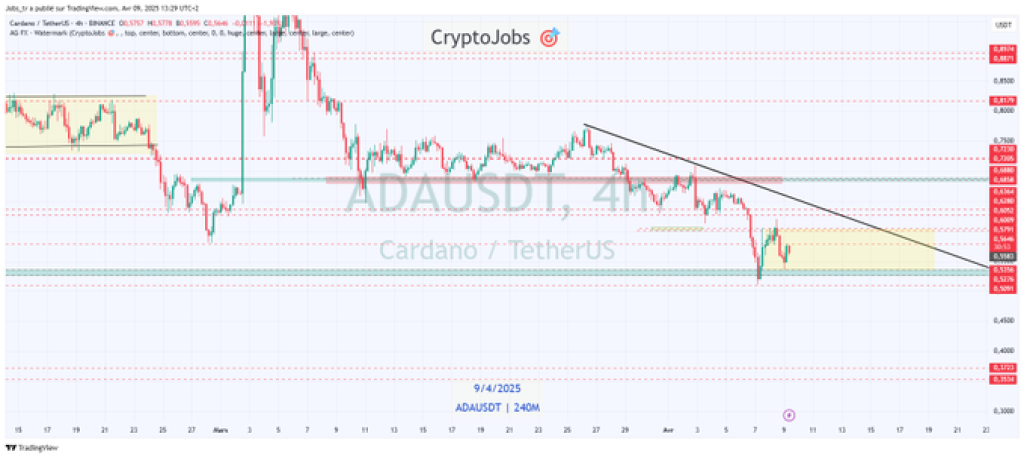
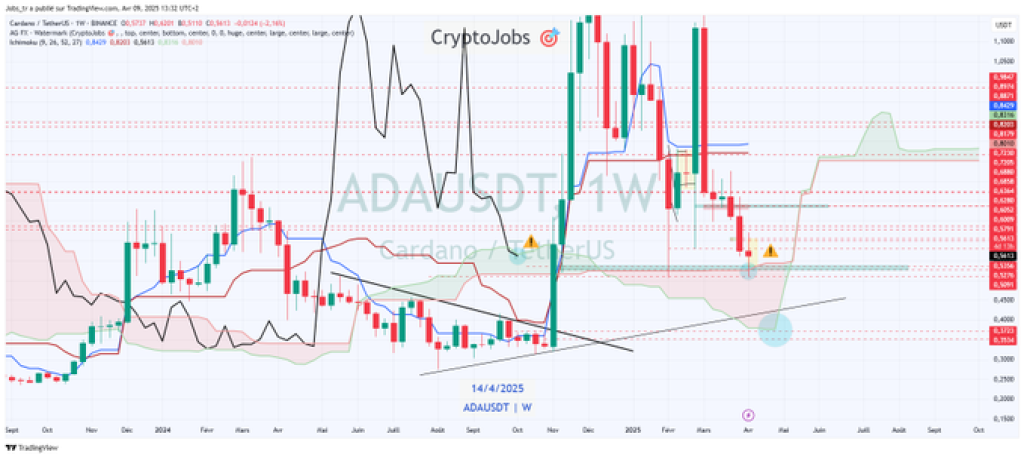
In a fresh update on X (formerly Twitter), top analyst CryptoJobs pointed out that the price of ADA is still stuck below its main bearish trendline on the 4-hour chart. Another bearish retest just played out, which suggests the downtrend is still in control. The weekly chart isn’t offering much clarity either; it’s showing a doji candle, which typically signals hesitation in the market. Right now, all eyes are on the $0.5250 support level.
Read Also: PENDLE Price Retests Previous Resistance – This Chart Pattern Has a 78% Win Rate
If that support gives way on a weekly close, CryptoJobs warns that we could be looking at a deeper drop, potentially to $0.3700. That’s about a 30% slide from current levels. For now, traders are keeping a close watch on two key zones: $0.6080 and $0.5350. These could end up acting as resistance if ADA tries to bounce or as pivots for more sideways price action.
What you'll learn 👉
Cardano Key Chart Structures Point to Possible Continuation
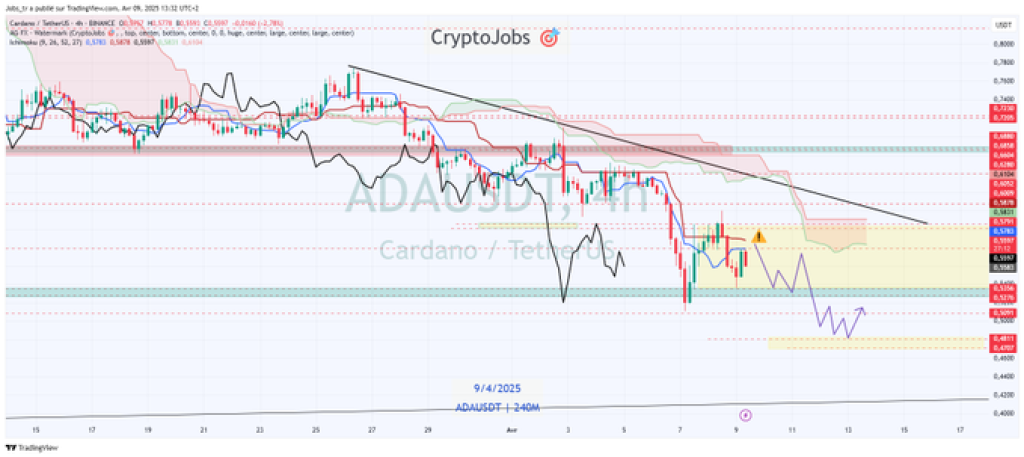
Multiple chart timeframes, including daily and 4-hour views, confirm the presence of a strong bearish trend. ADA price broke below the $0.5350 support level and failed to reclaim it, reinforcing the bearish setup. A descending trendline continues to act as resistance, while price action appears to be consolidating within a descending triangle pattern.
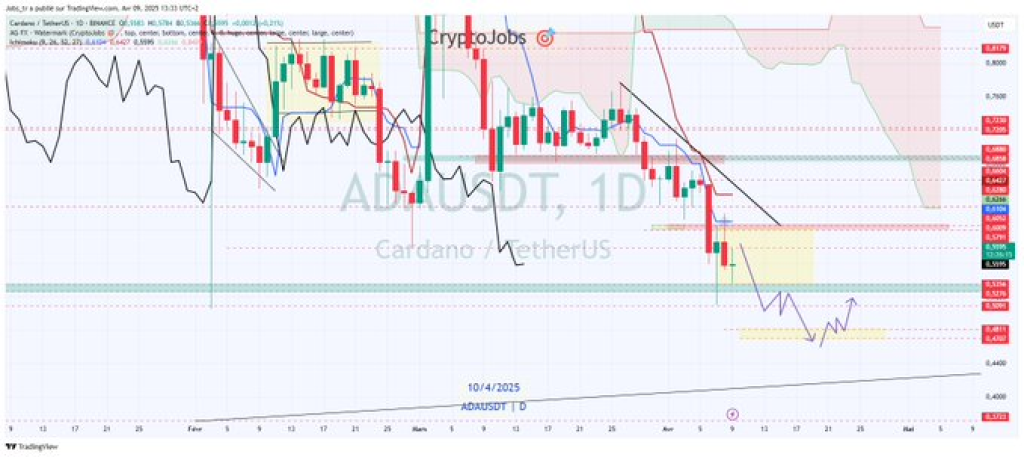
Ichimoku Cloud analysis shows Cardano price trading well below the Kumo cloud, with bearish Tenkan and Kijun alignments. The yellow rectangular zone between $0.48 and $0.51 on the charts is being observed as a potential short-term support or liquidity zone.
Cardano Weekly Outlook Hinges on $0.5250 Support Zone
The weekly chart shows ADA price hovering just above the $0.5250 level, which has so far acted as a strong base. Historical price action and trendline support converge around this area. A candle close below this level could lead to further drops toward the $0.4450 and $0.3700 levels.
Past bullish momentum from January has been completely retraced. Continued failure to break above $0.5350 may result in extended sideways trading or a breakdown if broader market weakness persists.
Broader Market Sentiment May Influence ADA Price Movement
The tweet notes that Bitcoin’s price movement could heavily influence ADA. If Bitcoin continues to fall, it might trigger selling across altcoins, potentially pushing ADA down to support levels at $0.4800, $0.4450, $0.4000, $0.3700, and $0.3350.
ADA’s short-term picture remains somewhat unclear, with signs of consolidation. Traders are keeping an eye on how ADA price responds near the $0.5250 and $0.5350 marks.
Subscribe to our YouTube channel for daily crypto updates, market insights, and expert analysis.

We recommend eToro
Wide range of assets: cryptocurrencies alongside other investment products such as stocks and ETFs.
Copy trading: allows users to copy the trades of leading traders, for free.
User-friendly: eToro’s web-based platform and mobile app are user-friendly and easy to navigate.