Cardano price action is showing promising signs of a potential reversal after a period of downtrend. The daily candlestick chart for Cardano (ADA) against the US Dollar shows a significant development with the TD Sequential indicator, which is known for signaling potential trend reversals.
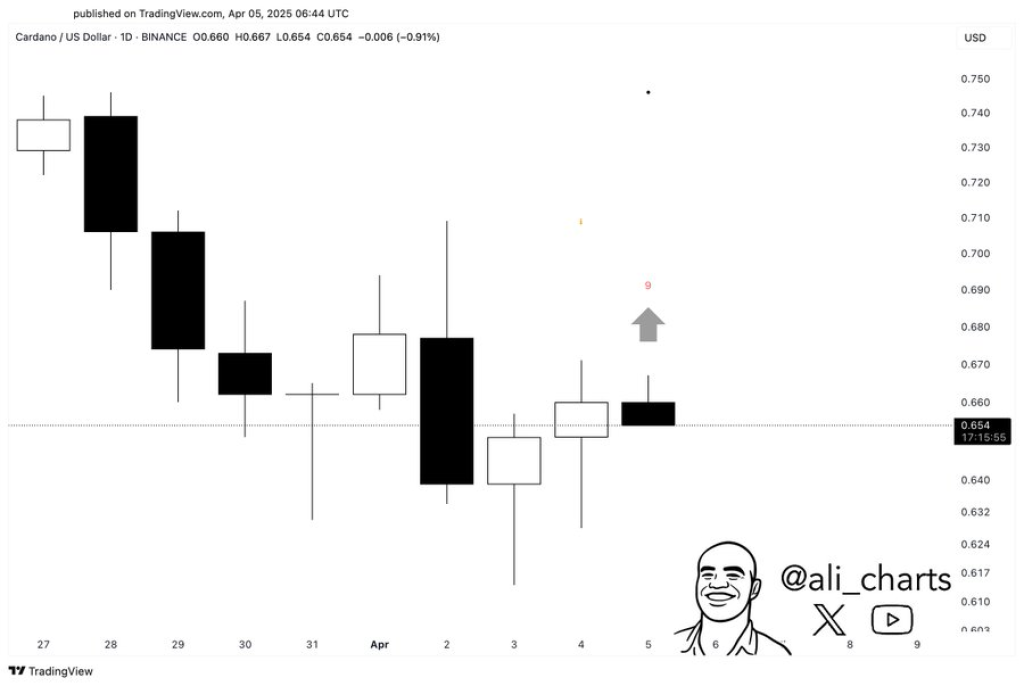
According to a chart shared by Ali Charts on X, ADA has reached an important technical juncture. The trader’s analysis points to a TD Sequential “9” signal appearing on April 5, suggesting the recent bearish momentum may be exhausting itself.
What you'll learn 👉
TD Sequential Signals Potential Reversal for ADA Price
The daily candlesticks from late March to early April 2025 show that ADA has experienced a downtrend, with several strong bearish candles followed by smaller-bodied ones that indicate indecision or consolidation. Notably, the candles on April 4 and 5 are relatively small, showing reduced selling pressure and possibly hinting at a bottom formation.

The TD Sequential indicator displays a red “9” above the April 5 candle, which is the key signal Ali is highlighting. This “9” in the TD Sequential setup typically signals trend exhaustion after a 9-day bearish sequence, increasing the probability of a bounce or upward move in the coming days.
A gray upward arrow reinforces the idea of a potential reversal. The support zone appears to be in the $0.620–0.655 range, where ADA has bounced multiple times recently. If this reversal materializes, the immediate resistance and target would be near the $0.680–0.700 level.
Support Zone Holding Strong for Cardano
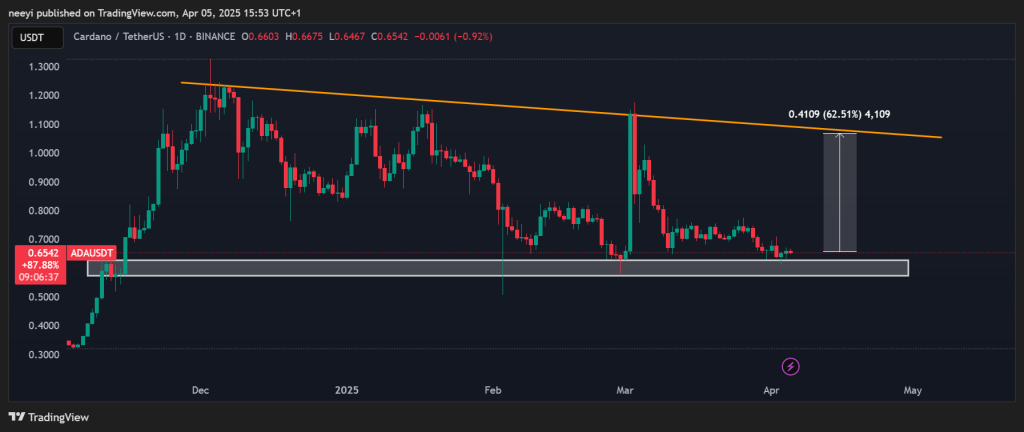
Since early November 2024, Cardano has tested the $0.57–$0.60 support zone multiple times and consistently respected it. This horizontal zone is well-established and shows significant accumulation interest from buyers. Recent price action reveals long lower wicks on the candles, suggesting that buyers are actively defending this critical support level.
This pattern of support holding is becoming increasingly important for Cardano medium-term outlook. The repeated defense of this zone indicates strong buying pressure whenever ADA approaches these levels.

Descending Trendline Presents Key Resistance for ADA
The chart analysis by Ali also highlights an orange diagonal line marking lower highs dating back to December 2024. Each rally has been rejected near this descending trendline, forming a textbook descending triangle structure in Cardano’s price action.
A potential breakout from this pattern would be significant. If ADA manages to close above this trendline with substantial volume, it could mark a decisive trend reversal for the cryptocurrency. Traders following Ali’s analysis are watching this trendline closely as it represents the primary barrier to higher prices.
Read Also: Analyst Explains How Cardano (ADA) Could Spike to $50 — Here’s the Shocking Timeline
Bounce Scenario and Price Targets for ADA
If history repeats itself, Cardano price could bounce off the $0.6 zone once again, potentially rallying toward the descending trendline around $1.05–$1.10. This would represent approximately a 62% gain from current levels.
This spike could happen swiftly if momentum kicks in, similar to what we saw with ADA’s price movement in March 2025. Traders should watch for several key indicators to confirm this bounce scenario:
Subscribe to our YouTube channel for daily crypto updates, market insights, and expert analysis.
We recommend eToro
Wide range of assets: cryptocurrencies alongside other investment products such as stocks and ETFs.
Copy trading: allows users to copy the trades of leading traders, for free.
User-friendly: eToro’s web-based platform and mobile app are user-friendly and easy to navigate.


