
In our last Hedera price prediction, we said buyers needed to reclaim $0.070 and then $0.073 to put $0.0757 back into play. Instead, the neutral case played out almost perfectly. Hedera spent most of the week bouncing between $0.067 and $0.070. That $0.067 level got tested a few times, but it held each time.
Right now, the HBAR price is at $0.0668, up a little under 1% over the last day. But Bitcoin did a bit better, it’s up over 1%.
The whole crypto market added about $20 billion in value, which sounds nice. But the Fear & Greed Index is still stuck at 35. That tells you traders aren’t exactly feeling bold. This week could be the one where HBAR finally breaks out of its range, or it could just settle in for more of the same sideways action.
What you'll learn 👉
Catalysts Driving the Hedera Price This Week
The price just isn’t cooperating, even though the network is busier than ever. HBAR is down 37% since the year started. And it’s still almost 88% below that peak it hit back in September 2021.
But when you look under the hood, things look different. Daily active wallets are up 190% from a year ago. And dApp transaction volume has jumped 386%. That’s real growth, enterprises are clearly using the network more.
The catch is that a lot of that activity is coming from prepaid accounts. So even though the network is humming, it doesn’t automatically translate into people buying HBAR on the open market.
Institutional access expanded after Hedera integrated with Utila, a digital asset custody platform that has processed more than $200 billion in transaction volume. The partnership gives financial institutions access to MPC wallets, compliance tools and secure custody for HBAR and Hedera Token Service assets, reducing operational barriers for regulated investors.
Traditional finance also delivered another real-world use case. Lloyds Banking Group, Aberdeen and Archax completed the United Kingdom’s first foreign exchange trades using tokenized money market funds and UK government bonds as collateral on the Hedera blockchain.
The pilot targeted a market that handles almost $5.4 trillion in daily FX volume, giving Hedera another enterprise deployment inside regulated finance.
What Is the Hedera Chart Showing?
We had a look at the chart and found the broader trend remains bearish. Since early June, the HBAR price has continued printing lower highs and lower lows, falling from above $0.098 to the $0.066 area.
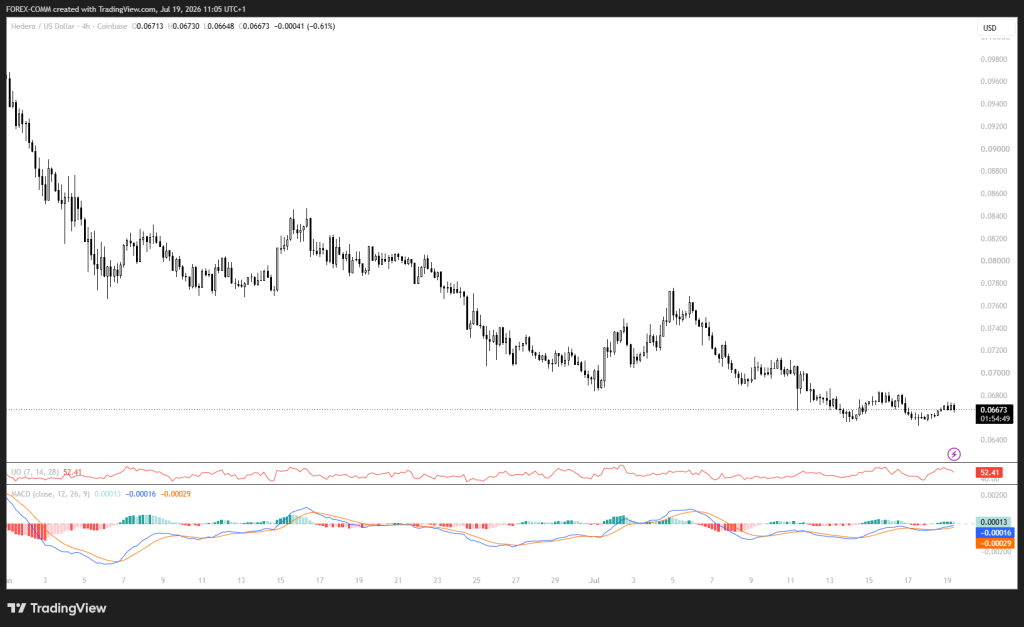
The selling has cooled off. Buyers stepped in to defend that $0.065 to $0.066 area, and it’s held up. Now HBAR is moving in a tighter range than we saw earlier this month. The ceiling above is still $0.0685 to $0.070, that’s where rallies have died before.
The Ultimate Oscillator is at 52.41, just above the halfway mark. So buyers have a slight edge, but nothing strong.
And the MACD is starting to turn. The main line just crossed above the signal line for the first time in a while, and the histogram flipped positive. It’s a small move, but it’s the first sign that the downward pressure we’ve seen for weeks might be losing its grip.
Related Hedera News: Kaspa (KAS) vs. Hedera (HBAR): Which Is the Better Buy for 2030?
Where Will the Hedera Price Go This Week?
If things go right:
Buyers need to take back $0.0685 and push through $0.070. If they do, $0.073 is next. And if they really get going, $0.0757 could come into view, especially if partnerships like the one with Utila keep bringing in more institutional adoption.
If things stay the same:
Most likely, we’re looking at another week stuck between $0.065 and $0.070. The HBAR chart has settled into a balanced state after days of sideways action, and there’s nothing big enough on the horizon to force a real breakout.
If things go wrong:
Losing $0.065 could send the HBAR price down to $0.063 or $0.064. With the Fear & Greed Index still at 35, sentiment is weak. That gives sellers a better chance of pushing the downtrend further.
Frequently Asked Questions
Subscribe to our YouTube channel for daily crypto updates, market insights, and expert analysis.