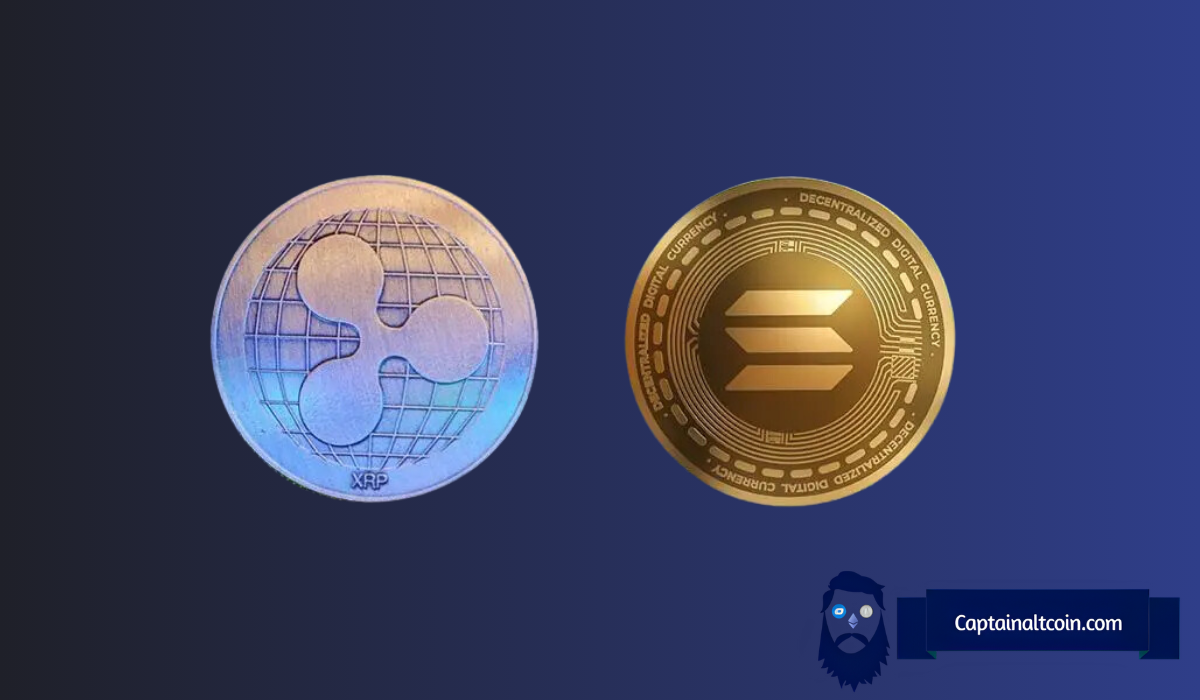
A lot of worrying signs for crypto traders this week as analysts report the decrease in capital inflows in Bitcoin and other cryptos.
The XRP price took a hit and is now down 3% in the last 24 hours, now trading below $2.60. Solana holders have even more reasons to be worried since the SOL price lost 8.5% today and is now trading around $166, which is well below its ATH of around $294 set just last month.
Crypto analyst Ali Martinez just posted viral XRP and Solana charts, both with bearish signals.
What you'll learn 👉
XRP Price Shows Concerning Signals
Looking at the XRP chart shared by Martinez, several warning signs are emerging. The cryptocurrency has been trading in an upward trend, but the latest price action shows a bearish candlestick pattern that could signal a reversal. This comes after a strong series of bullish candles that pushed XRP higher in recent weeks.
$XRP may be set for a pullback, as the TD Sequential indicator flashes a sell signal on the daily chart! pic.twitter.com/1EcPCC2gXT
— Ali (@ali_charts) February 18, 2025
The TD Sequential indicator, which traders use to spot potential trend reversals, is now flashing a sell signal with a green “9” appearing just before the bearish candle. This technical pattern often indicates trend exhaustion and suggests that XRP might be due for a pullback.
The XRP price recently tested resistance near the $2.85-$2.90 range but failed to hold above these levels. With increasing selling pressure, XRP is now retreating towards the $2.50-$2.54 zone, and further downside could be possible if this bearish momentum continues.
Read also: 6 Reasons Why Ripple (XRP) Price Rally is Not Over
Solana Network Activity Raises Red Flags
The situation for Solana looks even more concerning, with on-chain metrics painting a troubling picture. According to Martinez’s analysis, Solana’s network has experienced a dramatic decline in active addresses. From a peak of 18.5 million active addresses recorded on October 22, 2024, the number has plummeted to just 8.4 million by February 15, 2025 – representing a more than 50% decrease in network activity.
The number of active addresses on the #Solana $SOL network has dropped from $18.5 million in November to just $8.4 million today! pic.twitter.com/sXr1XWQrOz
— Ali (@ali_charts) February 18, 2025
This significant drop in network usage appears to be catching up with the SOL price action. While SOL’s value initially showed resilience, moving from $161.34 in October to $294 in mid-January, the token is now experiencing a sharp decline. Today’s 8.5% price drop to $166 might be just the beginning of a larger correction as the market begins to react to these deteriorating network metrics.
All in all, today’s SOL price action suggests that reality might be finally catching up with Solana’s valuation. Not only Solana holders, but all traders looking to trade on this network should watch closely these on-chain stats as Solana price can affect the whole ecosystem.
Subscribe to our YouTube channel for daily crypto updates, market insights, and expert analysis.
We recommend eToro
Wide range of assets: cryptocurrencies alongside other investment products such as stocks and ETFs.
Copy trading: allows users to copy the trades of leading traders, for free.
User-friendly: eToro’s web-based platform and mobile app are user-friendly and easy to navigate.


