
The global crypto market has slipped today, with total market capitalization down over 3% to $3.78 trillion. Trading volume is up 3.6%, showing that sellers are active as the market tests a key support zone.
The structure of the market has shifted to a cautious stance after weeks of bullish momentum, and price charts show that buyers are defending crucial levels.
At the same time, the top two cryptocurrencies are under pressure. Bitcoin price is trading at $115,609, down about 2%, while Ethereum (ETH) is at $3,680.44, down more than 4% in the past 24 hours.
Leading altcoins like XRP, SOL, and BNB are also in the red, and Pump.fun has seen the steepest decline, dropping over 19% in a day.
What you'll learn 👉
Crypto Market Faces Tariff Shock
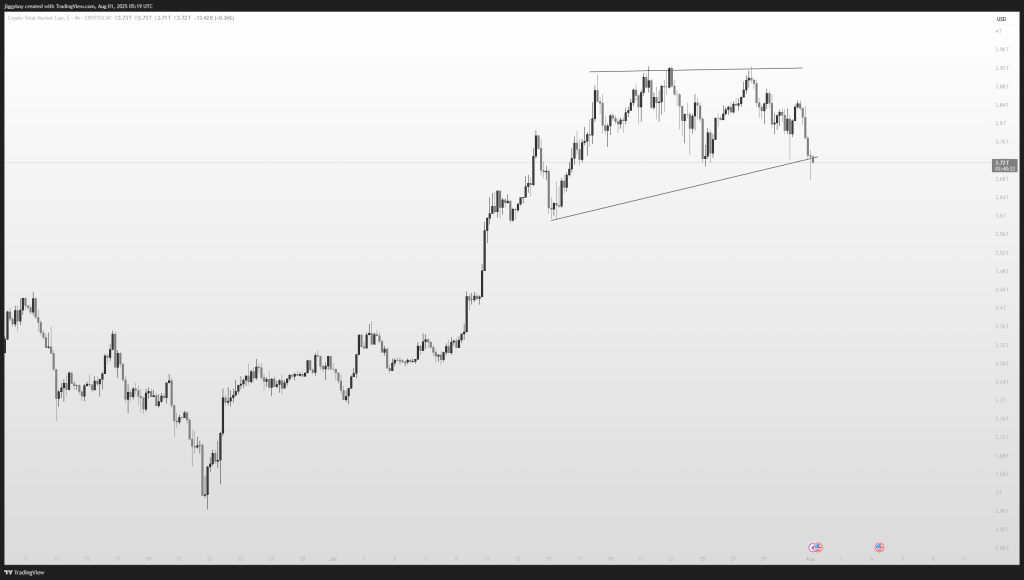
The total crypto market cap chart shows a market that rallied sharply in July before forming a rising wedge pattern. Price topped out near $3.92 trillion and has since fallen to test $3.70–$3.72 trillion support.
A lower wick on the 4-hour chart indicates some buyers are stepping in, but if this level breaks, a slide toward $3.60 trillion or even $3.50 trillion could follow.
This pullback is largely driven by macro events. President Trump’s August 1 executive order introduced tariffs of up to 39% on trade partners like Taiwan and Vietnam, sparking a 3.1% crypto market selloff as investors reduced exposure to risk assets.
🚨 HIGH IMPACT
— Forex Factory (@ForexFactory) July 31, 2025
Trump announces tariffs on countries ranging from 10% to 41%#forex https://t.co/Mq9Rcw9P7g
ETF flows also reflect shifting sentiment. TheCryptoBasic reported that on July 31, Bitcoin spot ETFs saw $114.83 million in net outflows, while Ethereum spot ETFs recorded $17 million in net inflows, showing a cautious rotation in institutional focus.
On July 31, Bitcoin spot ETFs recorded a net outflow of $114.83 million, while Ethereum spot ETFs saw a net inflow of $17 million. pic.twitter.com/P9CIujuRN0
— TheCryptoBasic (@thecryptobasic) August 1, 2025
Bitcoin Price Tests Key Zone, Bulls Still Watching
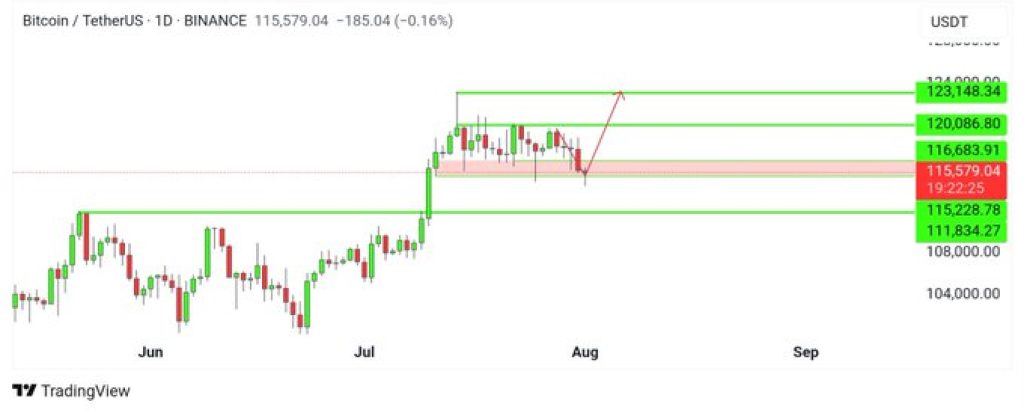
Bitcoin’s structure still leans bullish on the higher timeframes despite the dip. The $115,000–$116,700 zone is acting as the main support area.
Trader Cryptocandy noted that BTC price has yet to close below this range, even though a wick briefly dipped under it to potentially fill a CME futures gap.
He added that as long as the zone holds, BTC could still aim for $120,000–$123,000, while a confirmed breakdown would expose $111,800 as the next support.
The daily chart reflects a classic move: strong rally → sideways consolidation → support retest. Bulls are holding the line for now, but a decisive close below support would likely accelerate downside pressure.
Ethereum Price Feels the Weight of Liquidations
Ethereum saw heavier pressure as leveraged positions unwound. CoinMarketCap data shows $115.8 million in ETH longs liquidated within five hours, and funding rates turned negative for the first time since June 25. Retail traders absorbed most of the losses, leaving the market vulnerable to further swings.
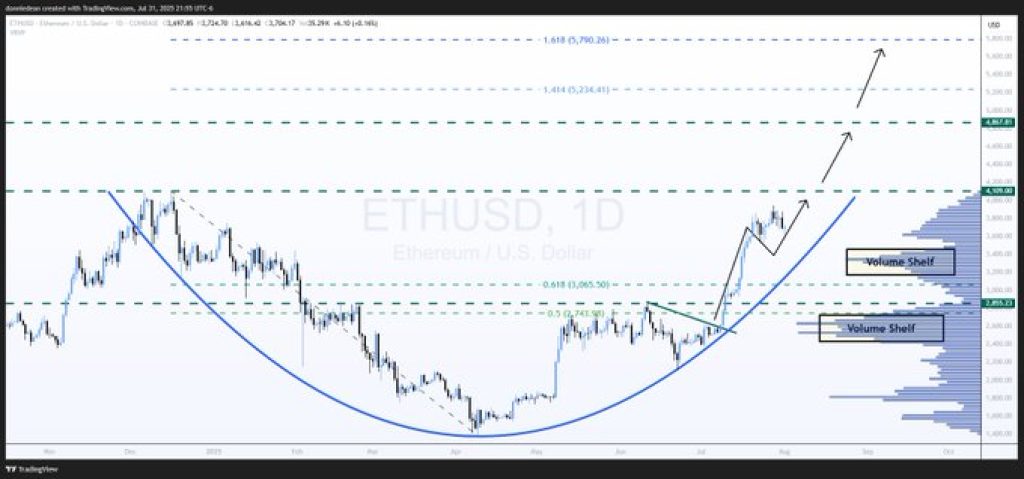
Analyst Donald Dean highlighted on X that ETH price remains in a symmetrical upward pattern with targets at $4,109, $4,867, and $5,790 if the trend resumes.
On the chart, ETH has just completed a rounded bottom formation, and the range of $3,200–$3,300 is its strongest support. Being above there preserves the overall bullish setup in spite of near-term selling.
Today’s move shows a market testing its limits after a strong summer rally. The crypto market structure is still bullish long-term, but traders are watching these support zones closely. If buyers can defend them, the next leg higher remains on the table.
Read Also: Ripple’s CTO Hints at Big Change as XRPL On-Chain Payments Near Reality
Subscribe to our YouTube channel for daily crypto updates, market insights, and expert analysis.