
Gold has reversed course after an impressive run through much of August. The gold price reached about $4,697 per ounce on August 25, but that rally has since given way to a deeper correction that has erased part of the month’s advance.
Several forces are working against gold at the same time. Federal Reserve policy expectations have changed, Treasury yields have climbed, and the U.S. dollar has strengthened. Oil prices and inflation concerns have also complicated the usual relationship between geopolitical uncertainty and demand for gold.
The technical picture deserves equal attention. Gold has lost an important support area, and several indicators now point in different directions. That leaves the next major support level particularly important for what happens next.
What you'll learn 👉
Federal Reserve Rate Expectations And A Stronger Dollar Are Pressuring Gold Price
Gold’s latest decline followed a strong August run that took the precious metal to around $4,697 on August 25. Safe haven demand and lower bond yields had helped gold reach that level, but conditions changed during the final days of the month.
Several factors have contributed to the gold price decline:
- Federal Reserve policy expectations changed: Federal Reserve Chairman Kevin Warsh delivered hawkish remarks at Jackson Hole on August 28 and indicated that more work was needed to contain inflation.
- Rate hike expectations increased: The probability of a 25 basis point rate increase at the September 16 meeting climbed to 67%, compared with 39% about 1 week earlier.
- Treasury yields moved higher: The U.S. 10 year Treasury yield climbed toward 4.80%, which makes interest bearing assets more competitive against gold.
- The U.S. dollar strengthened: The dollar index reached 99.67, its highest level in about 2 weeks. A stronger dollar can make gold more expensive for buyers who use other currencies.
- Profit taking followed the August rally: Gold gained close to 15% earlier in August. The decline from $4,697 has therefore erased part of a very strong monthly advance.
Higher interest rates are particularly important because gold does not generate interest. Investors can become less willing to hold the precious metal when Treasury securities offer higher yields.
Rising Oil Prices Are Complicating Gold’s Usual Safe Haven Role
Middle East tensions might ordinarily offer some support for gold, especially when uncertainty increases across global markets. Recent developments have produced a more complicated situation.
Renewed conflict involving the U.S. and Iran helped push Brent crude oil above $95 per barrel. Higher energy prices can feed directly into inflation expectations, and persistent inflation could give central banks another reason to maintain restrictive monetary policy.
Gold therefore faces competing forces. Geopolitical uncertainty can increase demand for defensive assets, but higher oil prices can increase inflation concerns. Those inflation concerns can then support higher interest rates and bond yields, which create problems for gold.
The interest rate side of that equation has proved particularly important during the latest gold price decline.
Gold Price Break Below $4,330 Puts $4,169 Support Into Focus
A look at the gold price chart shows that the technical structure has weakened since the $4,697 peak.
Gold recently dropped below an important support zone around $4,330. Price then moved as low as approximately $4,280 before recovering toward the $4,300 region.
The $4,330 area now deserves close attention because previous support can become resistance after a breakdown. Gold could face difficulty extending its recovery if buyers cannot reclaim that area.
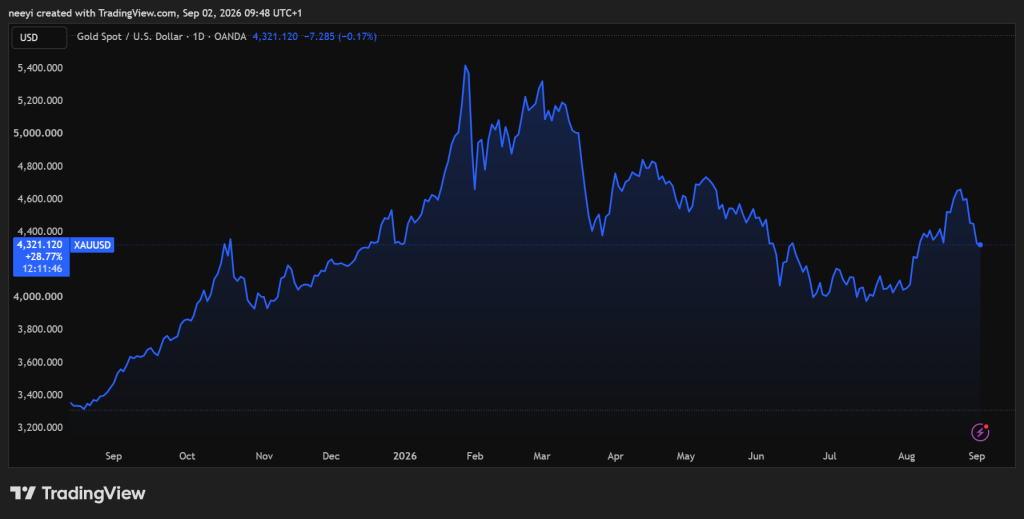
A rejection around $4,330 could expose the next important support around $4,169. That level is particularly important because it represents one of the final major support areas beneath the current structure.
The main levels can be summarized this way:
- $4,330: Former support that could now become resistance.
- $4,280: Recent low reached during the current decline.
- $4,169: Major support that could determine whether the broader structure remains intact.
- $4,697: Recent peak and the starting point of the current correction.
A break below $4,169 would create a deeper technical problem. Such a move would represent a break in the broader structure and could open the door to a more bearish gold price outlook.
The bullish case requires gold to recover above $4,330 and prove that the recent breakdown cannot hold. A stronger recovery beyond that area could then give buyers room to challenge higher levels again.
Gold Technical Indicators Show Buyers And Sellers Remain Divided
The technical indicators do not currently provide one clear directional message. Some measures remain bearish, but others show that buyers have not completely disappeared.
| Indicator | Value | Reading |
|---|---|---|
| RSI 14 | 46.053 | Neutral |
| Stochastic 9,6 | 42.219 | Sell |
| MACD 12,26 | 65.32 | Buy |
| Ultimate Oscillator | 38.224 | Sell |
The individual readings provide a clearer picture:
- RSI 14 at 46.053: The RSI remains close to the middle of its range. Gold is therefore neither clearly overbought nor oversold, although the reading below 50 shows limited bullish strength.
- Stochastic at 42.219: The sell reading points toward weaker short term price strength and fits with the decline from $4,697.
- MACD at 65.32: MACD provides the main positive reading with a buy signal. Some underlying bullish strength therefore remains despite the recent correction.
- Ultimate Oscillator at 38.224: The sell reading shows that downside pressure remains present across the periods measured by the indicator.
Taken together, these indicators produce a mixed picture with a bearish lean. Gold has not reached an extreme condition that guarantees either a rebound or another major decline.
Gold Moving Averages Put More Focus On The $4,300 Price Region
The moving averages also provide a mixed technical picture.
| Moving Average | Simple MA | Signal | Exponential MA | Signal |
|---|---|---|---|---|
| MA50 | $4,222 | Buy | $4,343 | Sell |
| MA200 | $4,536 | Sell | $4,312 | Buy |
The simple MA50 stands near $4,222 and gives a buy reading. Gold remains above this level, which means part of the medium term price structure remains intact despite the latest decline.
The exponential MA50 gives a different reading. That average stands near $4,343 and gives a sell signal because gold trades below it. Interestingly, the level is also close to the broken $4,330 support zone. A recovery through this region could therefore improve several technical measures at once.
Read Also: XRP Price Just Challenged One of the Biggest Ripple “Dump” Theories
The simple MA200 remains much higher around $4,536 and gives a sell reading. Gold would need a much larger recovery before reclaiming that longer term average.
The exponential MA200 stands around $4,312 and provides a buy reading. That places another important technical marker near the current gold price.
Gold therefore finds itself near an important decision zone. The $4,300 to $4,343 region could determine whether the latest recovery develops further or sellers regain control.
FAQs
Subscribe to our YouTube channel for daily crypto updates, market insights, and expert analysis.