
Ripple’s XRP latest headlines paint a mixed picture of real institutional progress, but with bearish pressure still hanging over the market.
SWIFT and Ripple executives reportedly met behind closed doors on February 14, sparking talk of a possible cross-border payments partnership.
A day later, XRP recovered slightly after Ripple’s Community Day event, where the team outlined a 2026 roadmap that includes regulated products like ETFs and wrapped XRP.
However, some analysts are still warning that downside risk isn’t gone, with bearish derivatives data pointing to a possible drop as low as $0.80.
So even with bullish developments in the background, the chart is still doing most of the talking right now. The XRP price is trading around $1.57.
What you'll learn 👉
Here’s What The XRP Chart Is Showing
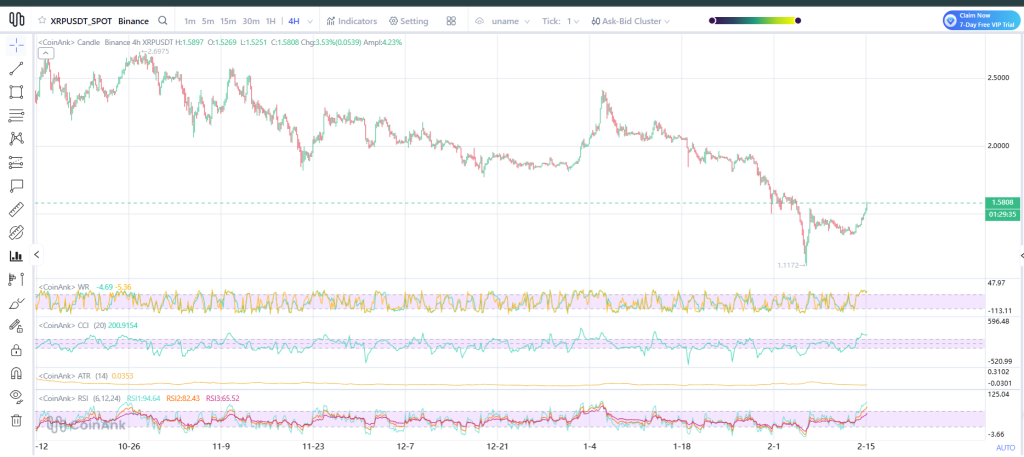
Looking at the 4H chart, XRP has been in a clear downtrend for weeks, sliding from the $2.50 region all the way into a sharp February selloff. That drop eventually printed a deep low near $1.11, which acted as a major bounce point.
Since then, the XRP price has started stabilizing and pushing higher, with XRP now reclaiming the $1.55–$1.58 zone. This is the first serious attempt at a recovery mechanism after the major breakdown, but bulls still have to prove that this move has underlying strength.
However, XRP is trying to build a base, but the trend is still a bit fragile until the resistance levels are broken.
What the Indicators Are Showing Right Now
Momentum indicators are starting to improve. The RSI has moved up sharply, sitting near the upper range, which signals stronger buying pressure returning after the oversold bounce. That’s often what happens after a capitulation-style drop like the one XRP just had.
The CCI indicator is also flashing high positive readings, showing that the XRP price recent rebound has real force behind it. At the same time, ATR remains fairly steady, meaning volatility has cooled down compared to the panic selling earlier this month.
Overall, the indicators point to a relief rally still in play, but XRP is now entering an area where resistance matters much more than momentum alone.
Read Also: What Triggered the $3.2 Trillion Sell-Off? Why Gold and Silver Slipped Again
Key Levels That Will Decide XRP Price Next Move
The key area to watch this week is around $1.60, which is becoming the first major ceiling after this bounce. If XRP can break through and stay above this area, then the chart is showing a potential to move into the next area of resistance.
On the downside, the support area around $1.45 to $1.40 is critical. Losing that area would put the XRP price back into a weak structure and bring the February lows back into focus.
This is the type of range where the next breakout or breakdown can happen quickly.
XRP Price Targets for This Week
If XRP clears $1.60, the next targets are $1.75 and then $1.95.
If the XRP price falls below $1.40, it could slide to $1.20. Below that, $1.10 is next, with $0.80 as the deeper downside level.
This week is all about whether the current bounce turns into a real reversal or fades into another decline.
Subscribe to our YouTube channel for daily crypto updates, market insights, and expert analysis.