Ripple’s XRP is trading around $2.05 at press time, holding just above a level that has mattered all week. In our previous update, the focus was on $2.00 as the line that keeps the short-term structure intact. That call played out.
The XRP price stayed above $2.00, pushed higher mid-week, and briefly touched $2.20 before pulling back again. The move confirmed demand below $2.00, even if the breakout didn’t stick.
The question now is simple: where is the XRP price headed next?
What you'll learn 👉
What’s Driving the XRP Price Right Now
Flows remain a key factor. U.S. spot XRP ETFs now hold about $1.56B in assets, with average daily inflows near $10.6M. Franklin Templeton’s XRPZ ETF alone added roughly $28.6M in a single week in January. These inflows matter because they help absorb supply.
At the same time, Ripple continues to sell roughly $200M worth of XRP per month to fund operations. That creates a steady supply overhang. For the XRP price to trend higher in a sustained way, ETF inflows need to keep outpacing those sales. If they slow, downside tests become more likely.
On-chain and positioning data add nuance. Large holders accumulated more than 50M XRP last week during sideways trading near $2.00. Exchange data showed daily net outflows of around $13.1M, which reduces immediate sell pressure. Derivatives positioning, however, is stretched. On Binance, the long/short ratio sits near 3.0, a sign that the market is leaning heavily bullish. That can fuel upside, but it also raises the risk of sharp pullbacks if price slips.
XRP Chart Analysis
We had a look at the XRP chart and it’s clear that the price action remains range-bound. $2.00 continues to act as firm support. Buyers have stepped in repeatedly near this level, keeping the XRP price from breaking lower.
On the upside, $2.20 is the first resistance to watch. That level rejected price earlier in the week. Above it, the $2.30 area lines up with prior supply and would likely require strong momentum to clear.
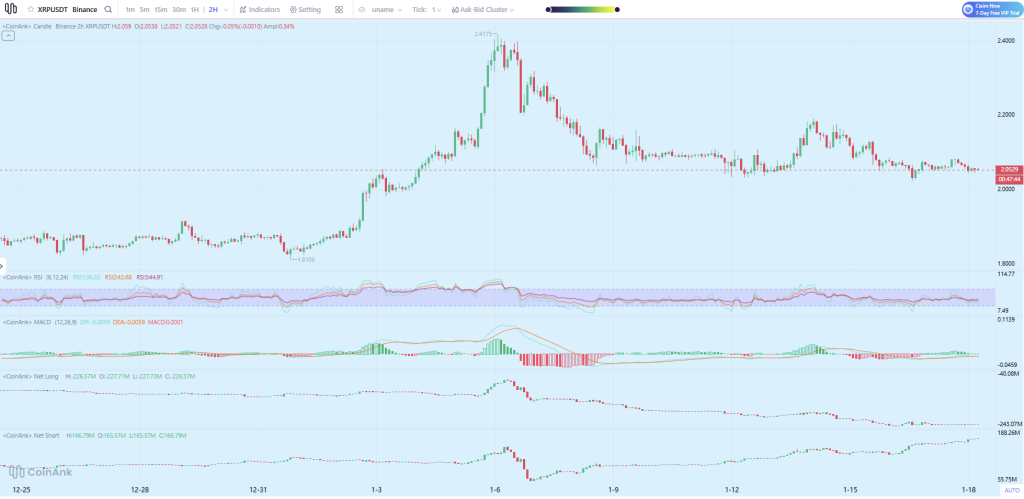
Momentum indicators show consolidation and not a trend in either direction. RSI is hovering in the mid-30s to low-40s, not oversold, but lacking strength. MACD is flat and near the zero line, suggesting indecision. Net longs remain elevated relative to net shorts, which supports the range but increases volatility risk if support gives way.
Overall, the chart shows balance. Sellers are active above $2.20. Buyers are active near $2.00.
Read also: XRP Price to $100? Burned Supply and Bank-Grade Design Are Changing the Math
XRP Price Prediction for This Week
As long as $2.00 holds, the near-term bias stays neutral to slightly bullish. In that scenario, the XRP price could make another attempt toward $2.15–$2.25. A clean break and hold above $2.20 would open the door to $2.30, but follow-through will depend on continued ETF inflows and stable broader market conditions.
If $2.00 fails on a closing basis, downside risk increases quickly. The next support sits near $1.80, a level that could attract buyers again but would reset sentiment in the short term.
For now, the most likely outcome is continued range trading between $2.00 and $2.20. Where the XRP price headed next depends on which side breaks first—and whether flows can keep pace with supply.
Subscribe to our YouTube channel for daily crypto updates, market insights, and expert analysis.