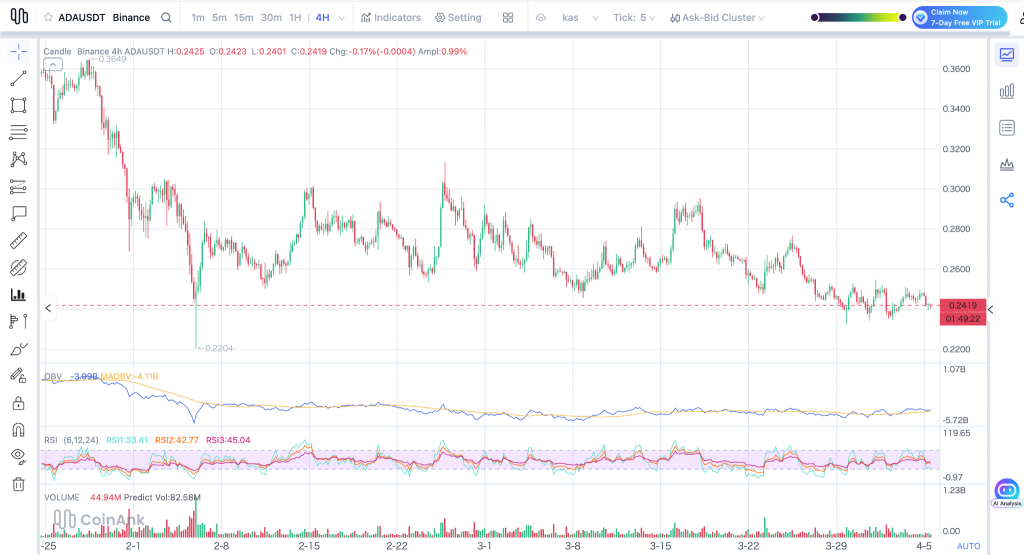
Cardano didn’t attract much attention this past week, with the ADA price moving just 0.18%. But when we took a closer look at the 4-hour chart, things started to get more interesting. After dropping from around $0.3649 in late January to a low near $0.2204 in early February, the ADA price hasn’t really bounced back, instead, it has been stuck moving sideways for weeks.
That sideways movement has formed a clear range between roughly $0.24 and $0.31, and that range has controlled the structure through March and into early April.
At the moment, the ADA price is around $0.2419, right on top of a key support level. This level has been held several times already, but there’s a catch: the more a support level gets tested, the more likely it is to give way. On top of that, every bounce since February has been weaker than the last, with lower highs forming each time. That’s usually a sign that sellers are still in control.
Looking at the indicators, there’s not much strength coming from buyers. The RSI is leaning toward the lower end, with the fastest setting getting close to oversold territory, but there’s no strong bounce yet.
Volume is also quite low compared to normal levels, which tells us traders aren’t committing heavily right now. The OBV staying deep in negative territory adds to the idea that selling pressure hasn’t gone away.
What you'll learn 👉
Ecosystem Developments Add Complexity
Outside of the chart, there’s quite a bit happening around Cardano itself. The network is working through a $71 million development plan focused on upgrades like Leios and Hydra. If these upgrades roll out successfully, they could make the network faster and cheaper to use, which could eventually support the ADA price.
There’s also the Midnight sidechain, backed by Charles Hoskinson. It’s designed to bring privacy features that could attract institutional users. Still, the current setup allows funds to move from Cardano into Midnight without an easy way back yet, which has raised concerns about liquidity leaving the main network for now.
On the regulatory side, there’s a bit more clarity. The U.S. Securities and Exchange Commission has classified ADA as a digital commodity, which could make institutional investors more comfortable. There’s also talk of a possible ETF, and if that gets approved, it could introduce a new wave of demand.
Read Also: $ADA Prediction: SEC, NASA, Google Cloud, and Now This Analyst Says Cardano Will Melt Faces
Market Structure Still Favors Sellers
Even with all that in the background, the chart is still the main driver for this week. The ADA price is right at support, and buying pressure looks weak. That kind of setup often leads to a breakdown if nothing changes quickly.
Any upward move right now also lacks conviction because volume hasn’t picked up. For a stronger recovery, the ADA price would need to climb back above $0.26–$0.27 with clear volume behind it, and then try to push toward $0.29. Without that, upward moves may continue to fade.
Where ADA Price Is Headed This Week
Right now, the downside looks more likely. If the ADA price drops below $0.2400 and volume increases even slightly, a move toward $0.2204 becomes very realistic. If selling pressure builds further, price could even dip toward the $0.20 level.
There is still a chance for a bounce. If buyers step in at this support and volume increases, the ADA price could move back up toward the $0.27–$0.29 range. But that move needs confirmation, not just a small reaction.
At this point, the ADA price is at a critical level. The next few candles should give a clearer direction, whether that’s a breakdown below support or a short-term recovery.
Subscribe to our YouTube channel for daily crypto updates, market insights, and expert analysis.