
Bitcoin is limping to the finish line in June. The BTC price is at $59,894.86, down 0.3% today. Trading volume shot up 45% though, volatility is creeping back in.
June has been ugly. Bitcoin dropped 18.5% this month, one of its worst performances in years. And the Russell 2000 is climbing, which tells you investors are moving their money into traditional risk assets instead.
Some analysts believe that rotation could eventually benefit crypto once profits begin flowing back into Bitcoin. For now, institutional selling, heavy ETF outflows, and weakening technical structure continue to keep the Bitcoin price under pressure as July begins.
What you'll learn 👉
News Pushing Bitcoin Price Lower
Big money pulling out is the main thing holding Bitcoin down. U.S. spot Bitcoin ETFs saw about $1.79 billion leave between June 22 and June 26. BlackRock’s IBIT alone accounted for roughly $1.3 billion of that.
June is now the worst month on record for these ETFs, with investors yanking $4.06 billion, beating the old record of $3.56 billion. When people redeem their shares, the funds have to sell Bitcoin into the market. That keeps the pressure on.
Spot Bitcoin ETFs Saw $1.79B in Net Outflows Last Week, Third-Highest Weekly Outflow on Record
— Wu Blockchain (@WuBlockchain) June 29, 2026
From June 22 to June 26 (ET), spot Bitcoin ETFs recorded net outflows of $1.79 billion, marking the third-highest weekly net outflow on record. Spot Ethereum ETFs saw net outflows of… pic.twitter.com/6CDFFVY68L
Outside factors aren’t helping either. Grayscale said things could get uglier if the CLARITY Act stalls in the Senate, crypto treasuries keep shrinking, and the Fed hikes rates again.
Grayscale: Bitcoin Could Fall Moderately Further if CLARITY Stalls and Fed Raises Rates
— Wu Blockchain (@WuBlockchain) June 29, 2026
Grayscale said that if the CLARITY Act clears the Senate, Strategy strengthens its balance sheet, and the Fed holds off on rate hikes, Bitcoin may already be close to its low. In a downside… pic.twitter.com/1lUCsuXpil
Jeremy Grantham also weighed in. He called Bitcoin a gamble that could end up at zero, but admitted blockchain tech itself has real-world uses.
Regulation is becoming a bigger topic too. The EU plans to ban cash payments over €10,000 and require ID for Bitcoin transactions starting in 2027. That’s still a few years out, but traders are already weighing what stricter rules could do to crypto adoption across Europe.
BREAKING:
— Crypto Tice (@CryptoTice_) June 29, 2026
The EU just banned cash payments over €10,000.
And will require ID for all Bitcoin transactions starting 2027.
Cash banned above €10,000.
Bitcoin requires ID.
Gold can still be bought anonymously.
The EU isn't fighting financial crime.
It's fighting financial… pic.twitter.com/Fz2B2gTJD8
Here’s What the Bitcoin Chart Is Showing
We had a look at the charts alongside analysis from Titan and Crypto Patel, and both point to the same area as the market’s biggest test.
Bitcoin closed the week under $60,000. That level used to be support. Titan said if BTC can get back above $60,000 this coming week, the breakdown could turn out to be a fakeout. But even then, there’s heavy resistance waiting in the weekly fair value gap around $68,000–$72,000 before the bigger picture starts looking better.
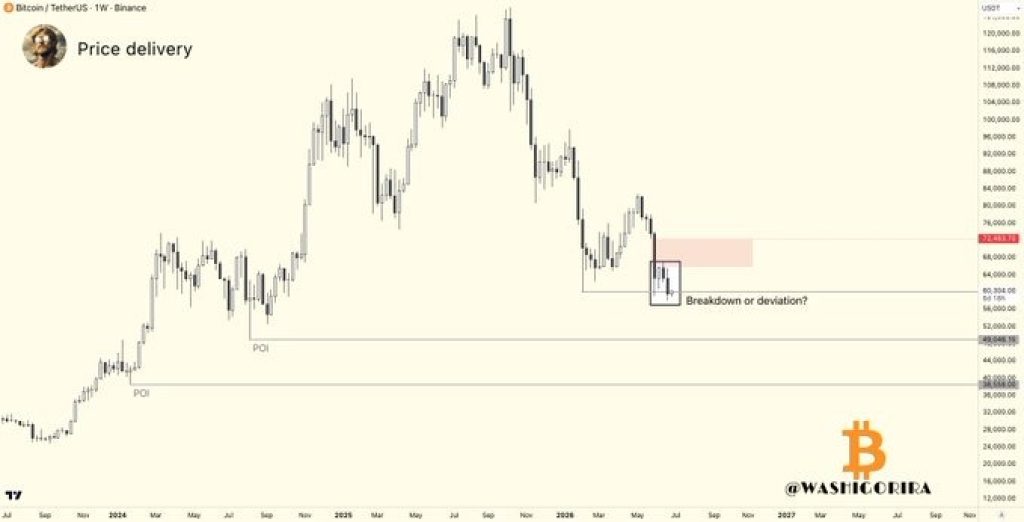
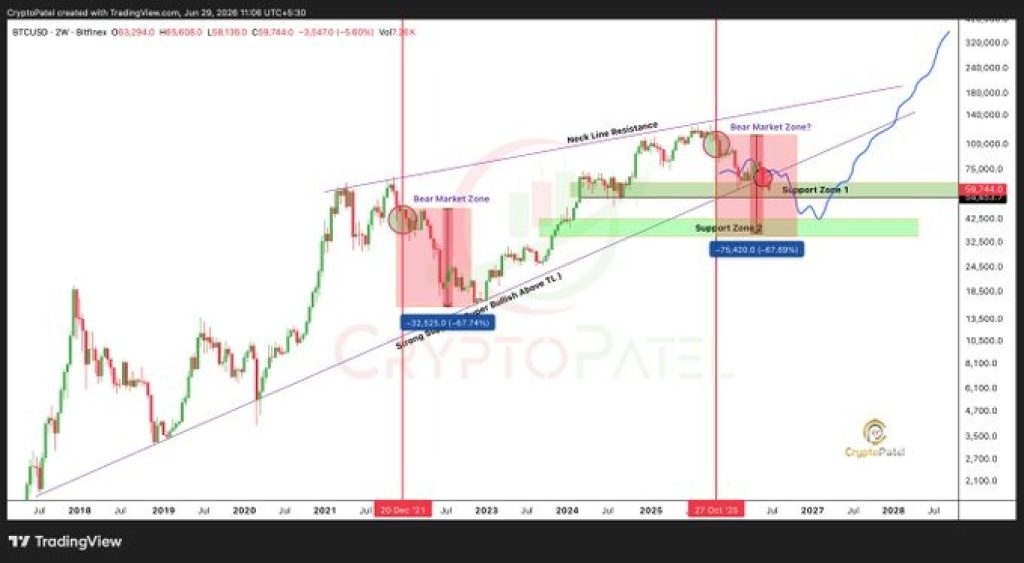
The longer-term view is cautious. Crypto Patel pointed out two big demand zones: roughly $45,000–$52,000 and $32,000–$40,000.
The first one lines up with old breakout levels and the long-term trendline that’s held since late 2022. If sellers keep pushing, that’s the first place where buyers might try to step back in.
The weekly chart shows the BTC price below that former support after failing to hold $60,000. The rejection near $72,000 made another lower high, so the bigger trend is still under pressure. Volume picked up on the way down, which means traders are active.
But a move back above $60,000 would be the first real sign that buyers are starting to absorb all that selling.
Related Bitcoin News: Crypto News Today: Bitcoin at $60K, ETF Outflows Hit $1.79B, and CLARITY Act Odds Slashed
How High Can BTC Price Go in July?
Likely Scenario
Most likely, Bitcoin settles into a range between $58,000 and $65,000 for a while. ETF outflows are still heavy, but buyers keep defending that $60,000 zone. If institutional selling slows down, BTC could find some stability before making its next move.
Bullish Scenario
If the Bitcoin price reclaims $60,000, closes back above that level on the weekly chart, and ETF outflows begin slowing, buyers could target the $68,000-$72,000 resistance zone identified on the charts. A clean break above that area would improve the broader technical outlook and could open the door to higher prices later in July.
Bearish Scenario
If ETF redemptions keep up at June’s pace and the broader economy gets worse, the BTC price could break below $58,000 and drop into that first big support zone around $45,000–$52,000. If that area fails to hold, then the deeper zone at $32,000–$40,000 comes back into the picture but that’s the less likely scenario for now.
Frequently Asked Questions
Subscribe to our YouTube channel for daily crypto updates, market insights, and expert analysis.