
Stellar is trading inside a narrow range this week. XLM is caught between institutional validation and competitive pressures, with its price action trapped between support and resistance that could define its next move.
XLM is attempting to recover from a decline that pushed it from early July highs near $0.24. The question for traders is whether Stellar can break through its immediate ceiling or if another pullback is more likely.
What you'll learn 👉
Stellar Price Today: Can XLM Extend Its Recent Recovery?
Stellar has shown signs of life over the past several sessions. The price moved from making lower lows into producing higher lows and suggests bearish momentum is fading. This change in market structure points to growing buyer interest, but the recovery faces a clear test.
The 2-hour chart shows XLM oscillating between roughly $0.179 and $0.194 over recent days. This sideways range, combined with gradually rising lows, suggests accumulation rather than distribution. Buyers continue defending pullbacks, and each test of resistance brings the price closer to a potential breakout.
Trading volume has declined, so any breakout needs confirmation through increased participation. The Relative Strength Index sits at 48.2 on the daily timeframe, neutral territory that leaves room for movement in either direction.
The Support and Resistance Levels That Could Shape XLM’s Next Move
Stellar faces a clear set of technical levels that will define its price action this week. The immediate support sits at $0.188-$0.189, an area that previously acted as resistance and now provides a floor for the price.
Major support lies at $0.180-$0.182, a zone that has been defended multiple times. A loss of this level would weaken the current recovery and likely cause selling pressure toward $0.175 and $0.170. This lower area is the key bullish invalidation zone.
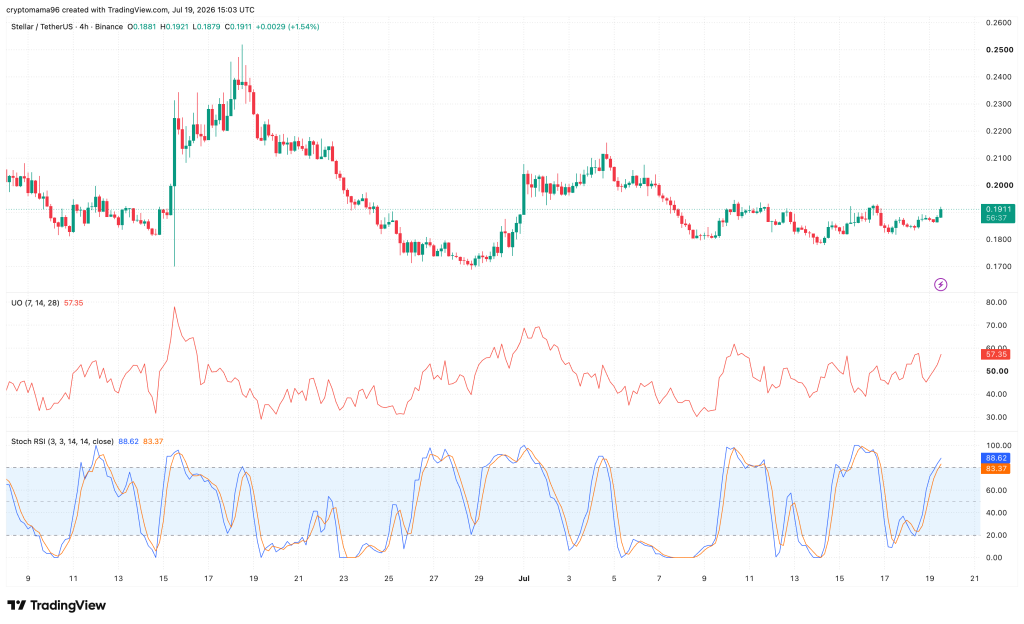
On the upside, Stellar must clear the first resistance at $0.193-$0.195, where multiple rejections have occurred. The major resistance sits at $0.200-$0.205, a psychological barrier and previous swing high.
A decisive close above this zone would confirm stronger bullish continuation, opening the door to $0.212, $0.220, and potentially $0.235-$0.240.
What the Technical Indicators Are Signaling for Stellar This Week
The Ultimate Oscillator on the 2-hour timeframe reads 59.9, sitting above 50 and confirming bullish momentum without entering overbought territory.
The 4-hour reading of 57.3 shows steadily strengthening momentum and supports continuation higher rather than immediate reversal.
The Stochastic RSI tells a slightly different story. The 2-hour reading of 95.8/83.1 sits very close to overbought, often preceding short-term consolidation or a shallow pullback rather than a major reversal. The 4-hour reading of 88.6/83.4 suggests the same caution.
The recent price structure is similar to a horizontal consolidation with slightly rising lows, giving it characteristics of an ascending triangle.
This pattern is generally viewed as bullish continuation setup, with flat resistance around $0.194-$0.195 and higher lows suggesting buyers are gradually gaining control.
Stellar Price Prediction: Can XLM Break Above Key Resistance?
Stellar’s price prediction for this week hinges on two scenarios. The bullish case needs a confirmed breakout above $0.195-$0.196, preferably after a candle closes above resistance. This could cause a move toward $0.200 and $0.205, with further targets at $0.212 and $0.220.
A buy-the-dip approach at $0.186-$0.188, followed by bullish confirmation, could provide a more favorable risk-reward entry with targets at $0.195, $0.200, and $0.205. The stop-loss should sit below $0.189 for breakout trades.
The bearish scenario comes into play if Stellar loses $0.180. This would invalidate the current higher-low structure and likely cause increased selling pressure toward $0.175 and $0.170. Traders should watch this level closely, as it is the line between recovery continuation and renewed decline.
The recent golden cross on the daily chart, where the 50-day moving average crossed above the 200-day average, remains a long-term bullish signal. However, the price has been rejected multiple times at $0.20.
Read also: Silver Price Prediction: Analyst Who Called $56 Support Now Says Correction Isn’t Over
Our Opinion: Is Stellar Positioned for a Stronger Move or Another Pullback?
Stellar’s technical structure is gradually improving, with higher lows developing and the Ultimate Oscillator above 50 on multiple timeframes. Buyers have repeatedly defended support, and the multiple attempts to break resistance suggest accumulation.
The caution lies in the Stochastic RSI, which is already in overbought territory, and the resistance near $0.195 that remains unbroken. The most likely scenario is either a brief consolidation or shallow pullback followed by another attempt to break $0.195-$0.200.
The bias is moderately bullish for Stellar this week, with a confirmed breakout above $0.200 needed to aid a sharper move toward $0.22-$0.25.
Frequently Asked Questions
Subscribe to our YouTube channel for daily crypto updates, market insights, and expert analysis.