
The crypto market has caught fire today, with total market value up more than 10% as Bitcoin price climbed to $72,000. PEPE has joined the move in a big way, jumping more than 20% over the past 24 hours to trade at $0.000003097.
The real eye-catcher is trading activity: PEPE volume has exploded more than 500%, showing that this move has plenty of participation behind it. Data from BSCN also shows PEPE leading the major OG memecoins, with DOGE and SHIB posting smaller 24-hour moves.
That combination of broad market strength, meme-coin rotation and heavy PEPE volume explains why the PEPE price is running higher today. The bigger question now is whether this rally can break the key resistance above it.
What you'll learn 👉
Why Is PEPE Price Up?
The first driver is meme-coin sector rotation. SHIB, DOGE and PEPE have all moved higher as traders moved into higher-beta crypto assets during today’s market rally. PEPE has led the three, gaining more than 19% in 24 hours.
The wider rally has also been supported by macro developments, including the U.S. Treasury’s plan to double long-term bond buybacks and comments from Donald Trump urging Congress to pass the CLARITY Act. Ethereum is up 19.47%, giving the meme-coin market another source of liquidity.
Read Also: Solana Price Could Be Getting Ready for the Move We’ve Been Waiting For
The second driver is volume. PEPE’s 24-hour trading volume jumped 573% to $528.4 million. That is important because the PEPE price did not rise on thin activity. The token also moved above its 7-day and 30-day moving averages, with RSI near 70.
That puts the PEPE price in a strong momentum zone, although RSI above 70 would increase the risk of an overheated move. PEPE also ranks among the top 10 trending cryptocurrencies, with its market capit above $1.2 billion.
Here’s What the PEPE Chart Is Showing
The PEPE chart shows a major breakout attempt after weeks of consolidation. The token spent much of August between roughly $0.00000255 and $0.00000295 before buyers pushed through the upper end of that range.
The latest move carried the PEPE price to $0.000003208 intraday before it settled near $0.000003095. That wick shows sellers are already active around the $0.00000320 area.
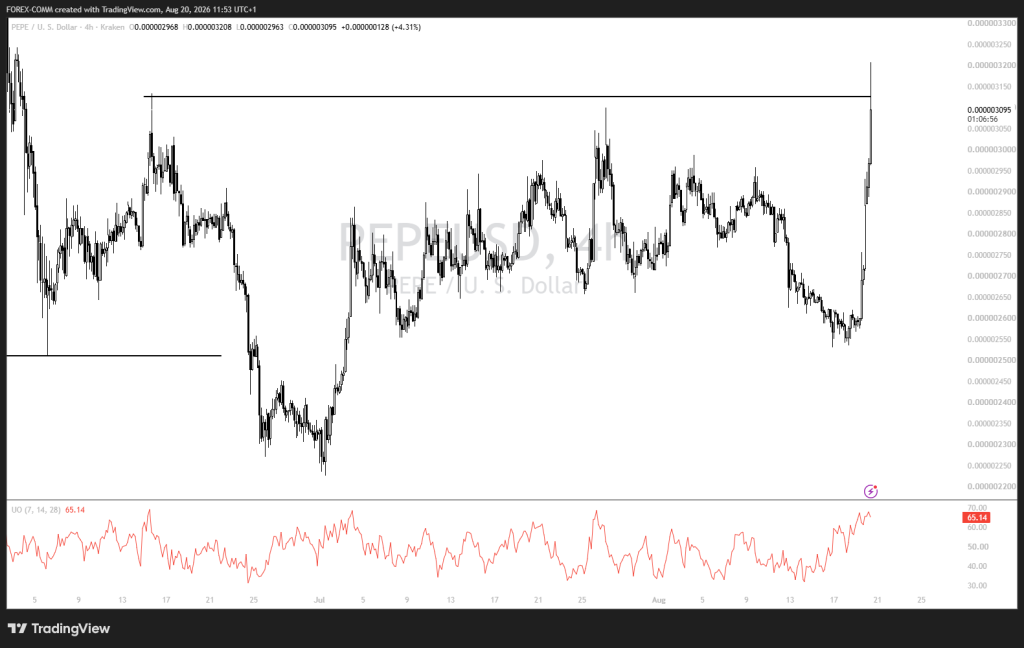
The big wall for the PEPE price right now is $0.00000313. You can see it plain as day on the chart, that horizontal line where sellers have parked themselves. If we get a 4-hour candle that closes above that line, it is a clean breakout. That is the green light. From there, $0.00000320 is the next stop, and then $0.00000330 after that.
Here is the good part: volume is up to $528 million. That matters. When a move has that kind of money behind it, it is more real. It is not just a few traders pumping it up on thin air. The momentum indicators are on the buyer’s side too.
Read Also: Bitcoin Price Prediction for Today (August 20)
The Ultimate Oscillator is at 65.14, that is the highest we have seen all month on this chart. It is not overheated yet because it is still below 70, but it is getting warm. The RSI is flirting with 70 as well, so there is not much room for error. If buyers cannot push through that $0.00000313 level, they are going to lose their nerve fast.
What happens if they fail? First, we drop back to $0.00000290. That is the initial floor. If that breaks, $0.00000275 is next. Go below that, and we are looking at $0.00000255, the old August bottom. The bigger picture stays okay as long as we hold above that $0.00000255 zone. But if that goes, the whole setup falls apart. No two ways about it.
Read Also: White House Crypto Summit: Trump Drops Major Bitcoin and CLARITY Act Statements
Where Will PEPE Price Go Next?
Bullish path:
Say PEPE pushes past $0.00000313 and there is real buying behind it, not just noise, then we are looking at $0.00000320 next. If that gives way, $0.00000330 is right there. From where we are now, that is about a 6.6% climb.
Base path:
What if the PEPE price hits that $0.00000313 wall and cannot break it? Then we are probably stuck in a range. Sellers take some money off the table, and we bounce around between $0.00000285 and $0.00000313. But as long as we hold $0.00000275, the bigger picture hasn’t turned ugly.
Bearish path:
Lose that $0.00000275 floor, and we drop fast. First stop is $0.00000255. If that breaks, $0.00000227 is the last line before things get really messy. That would kill today’s upward move and tell us the breakout above the August zone was a fakeout.
For now, keep your eyes on $0.00000313. That is the line in the sand. If volume pushes us over it, we aim for $0.00000330. If we get rejected there, then $0.00000290 and $0.00000275 are the numbers you need to watch.
Frequently Asked Questions
Subscribe to our YouTube channel for daily crypto updates, market insights, and expert analysis.