


Gold price is extending its recovery, with the precious metal pushing through another important technical level after gaining more than 5% this week.
Gold climbed as high as roughly $4,600 on Friday, reaching its strongest level in about three months. The latest leg of the rally has taken the metal decisively above its 200-day moving average and through the 38.2% Fibonacci retracement of the January-to-June decline.
The move has also spread across the precious metals market. Silver is up strongly this week (8%), and platinum (8.8%) has posted sizable gains of its own.
So, after clearing $4,574, where could the gold price go next?
What you'll learn 👉
Gold Price Breaks Above Another Key Level
Saxo Bank Head of Commodity Strategy Ole S. Hansen drew attention to the latest breakout in a post on X, accompanied by a chart mapping the key technical levels ahead. Hansen noted that gold had gained 1.8% on the day and 5.1% for the week as it traded around $4,600.
The first important development was the move back above the 200-day moving average. Hansen described that breakout as the technical trigger that brought fresh momentum buying into the market.
Gold has since cleared another hurdle.
The chart places the 38.2% Fibonacci retracement of the January-to-June correction at approximately $4,574. Gold’s move above that area opens the door to the next Fibonacci level if buyers can maintain control.
The 50% retracement sits at approximately $4,769, almost exactly in the same area as the local high recorded in May.
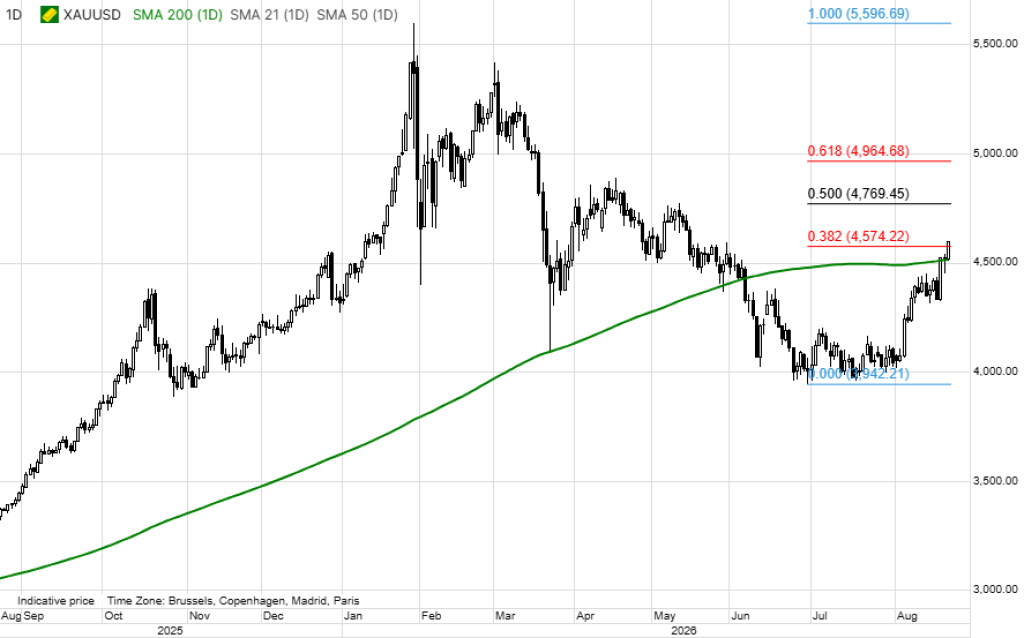
That makes the $4,770 area the next major level to watch.
Could Gold Price Reach $4,770 Next?
Hansen’s chart gives traders a fairly straightforward roadmap.
With $4,574 cleared, the next major technical target sits around $4,769-$4,770. A move there from $4,600 would require another advance of roughly 3.7%.
The importance of $4,770 goes beyond the Fibonacci retracement. It also coincides with a previous local high, meaning two separate technical levels converge in roughly the same area.
If the gold price eventually clears that zone, the next major Fibonacci level shown on Hansen’s chart is the 61.8% retracement at approximately $4,965.
Beyond that, the chart shows the full retracement of the January-to-June decline near $5,597.
Those higher levels remain some distance away. For now, $4,770 is the more immediate test.
The latest price action is nonetheless a significant improvement from June and July, when gold fell below $4,000 before beginning its current recovery.
Why Is Gold Price Pumping Right Now?
The breakout isn’t being driven by technicals alone.
Gold received a major boost this week after the U.S. Treasury announced an expansion of its purchases of older long-dated government debt. The announcement initially pushed Treasury yields lower and weakened the U.S. dollar, helping gold surge more than 3% on Wednesday.
The dollar remains an important part of the story. A weaker dollar generally makes dollar-denominated gold cheaper for buyers using other currencies, which can support demand.
There is also growing attention on the health of the U.S. government bond market. Concerns about U.S. debt and long-term borrowing costs have contributed to demand for hard assets, and the Treasury’s expanded buyback plans have revived concerns about fiscal conditions and the dollar.
Friday’s rally took spot gold to a three-month high. Reuters reported that the metal briefly reached around $4,601, with technical momentum and dollar weakness helping extend the advance.
Gold isn’t alone. Silver and platinum have also rallied heavily, adding to evidence that buying has broadened across precious metals.
Read also: Bitcoin vs. Gold: Is Saylor’s “Deep Freezer” Theory Being Tested?
Macro Factors Could Decide Gold’s Next Move
The bond market remains one of the biggest variables for gold.
Long-term Treasury yields are still elevated despite the initial decline following the Treasury announcement. The U.S. 10-year yield was around 4.7% on Friday, showing that pressure in the bond market hasn’t disappeared.
Higher yields can become a problem for gold because the metal does not pay interest. If Treasury yields continue climbing, investors have a greater incentive to hold interest-bearing assets instead.
The opposite scenario would provide another potential tailwind. A sustained decline in yields combined with further dollar weakness could make it easier for gold to continue toward Hansen’s next technical level.
Federal Reserve expectations are another factor. Markets are looking for additional clues on monetary policy around the Jackson Hole gathering, particularly after recent inflation concerns complicated the outlook for U.S. rates.
That leaves gold at an interesting point technically and macroeconomically.
The price has already cleared its 200-day moving average and broken above the $4,574 Fibonacci resistance. If buyers defend the breakout, Hansen’s chart puts approximately $4,770 firmly in focus.
A clean break above that level would bring the $4,965 region into view. For now, however, gold first needs to prove that this week’s strong rally can hold after one of its strongest stretches in months.
Subscribe to our YouTube channel for daily crypto updates, market insights, and expert analysis.






