
Gold traders have been piling into bullish positions at a pace not seen in months, and the options market is now showing just how far that move has gone. Fresh data from The Kobeissi Letter points to a wall of call buying on the gold ETF, and the timing lines up with a string of macro shocks that have pushed investors toward safety.
Gold itself has climbed steadily through August, and technical indicators are now flashing buy signals across the board. Here is what the numbers say, and what could come next for gold price.
The Kobeissi Letter, a well known markets commentary account, flagged a sharp build in bullish gold positioning this week. The analysis found that the gap between call open interest and put open interest on the SPDR Gold Shares ETF, ticker $GLD, reached close to 2.4 million contracts. That level marks the highest reading since February.
Bullish positioning in gold is surging:
— The Kobeissi Letter (@KobeissiLetter) August 24, 2026
The difference between call open interest and put open interest on the gold ETF, $GLD, hit ~2.4 million contracts this week, its highest level since February.
This gap has increased by +1.0 million contracts since Japan’s intervention to… pic.twitter.com/1TNxOTJGon
The Kobeissi Letter noted that this gap has grown by roughly 1.0 million contracts over the past three weeks, a window that started around the time Japan intervened to prop up the Yen. The pace of that increase picked up further after the US Treasury announced an unexpected move to double its planned buybacks of long dated government debt on Wednesday. Put together, those two events appear to have pushed more traders toward gold as a hedge.
The Kobeissi Letter also pointed out that this 2.4 million contract gap runs more than three times above the 2021 to 2024 average of around 0.8 million contracts.
A similarly large gap of close to 2.8 million contracts showed up in January and February, right around the time gold first broke above $5,500 per ounce. That earlier spike came during a comparable stretch of currency and macro uncertainty, and the current setup looks like a repeat of that pattern.
Gold Price Climbs Steadily Through August As Buyers Defend Key Levels
Gold has moved higher in a fairly consistent way since the start of August. The metal traded near $4,020 per ounce on August 3, and it now trades close to $4,697 at the time of writing. That works out to a climb of roughly 17% over the period, a move that has kept buyers firmly in control.
The next test for gold price falls at resistance near $4,744. A clean break above that level could open the door toward $4,900, and a stronger push of bullish momentum could eventually carry price as high as $5,200.
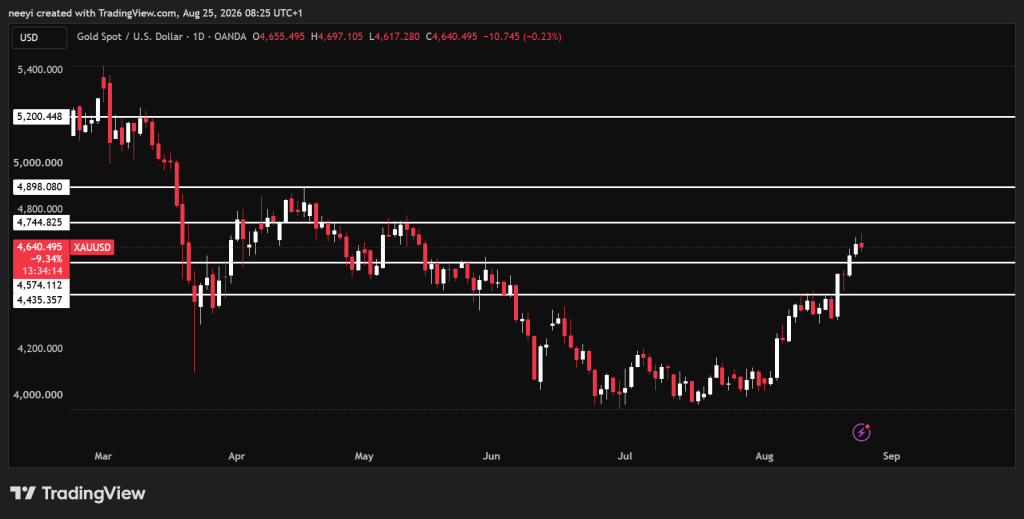
Support currently rests near $4,557, and that level needs to hold for the broader uptrend to stay intact. A failure to hold that zone could send gold back down toward $4,435, which lines up as the next major area buyers would need to defend.
A look at the technical picture backs up the bullish tone building around gold right now. The table below breaks down four widely used momentum indicators and what each one currently signals.
| Name | Value | Action |
|---|---|---|
| RSI(14) | 69.528 | Buy |
| STOCH(9,6) | 75.79 | Buy |
| MACD(12,26) | 126.78 | Buy |
| Ultimate Oscillator | 66.746 | Buy |
The RSI reading of 69.528 falls just under the traditional overbought threshold of 70. That level often shows up during strong trending moves, and it lines up with the steady 17% climb gold has produced since early August. It does not read as a sign that momentum is about to fade. The Stochastic reading of 75.79 points to a comparable picture. Price trades near the upper end of its recent range, and there is still some room before the reading hits extreme overbought territory.
The MACD value of 126.78 stays positive and elevated, and that fits with a market where the short term trend continues to run above the longer term trend line. Momentum indicators like this tend to stay strong for extended stretches once a clear breakout takes hold, and gold’s move past $4,600 fits that description.
The Ultimate Oscillator reading of 66.746 blends several timeframes together, and its buy signal adds weight to the idea that the current rally has support across short, medium, and longer term price action. That support does not appear to rest on a single burst of buying.
Read Also: Crypto Price Prediction for Today, August 25: XRP, Dogecoin (DOGE), and Zcash (ZEC)
Taken together, these four readings line up with the options market data from The Kobeissi Letter. Both data sets point in the same direction. Traders appear willing to keep adding to gold positions even after a strong month, and the technical setup has not shown any real warning signs of exhaustion so far.
Gold now finds itself at a point where options positioning, price action, and technical indicators all point the same way. A break above $4,744 could set up a run toward $4,900 or higher. A slip below $4,557 would put the $4,435 zone back in focus instead.
Japan’s currency intervention and the Treasury’s buyback surprise both played a role in pushing positioning this stretched, and any further macro surprises over the coming weeks could decide which of those two paths gold ends up taking.
FAQs
Subscribe to our YouTube channel for daily crypto updates, market insights, and expert analysis.